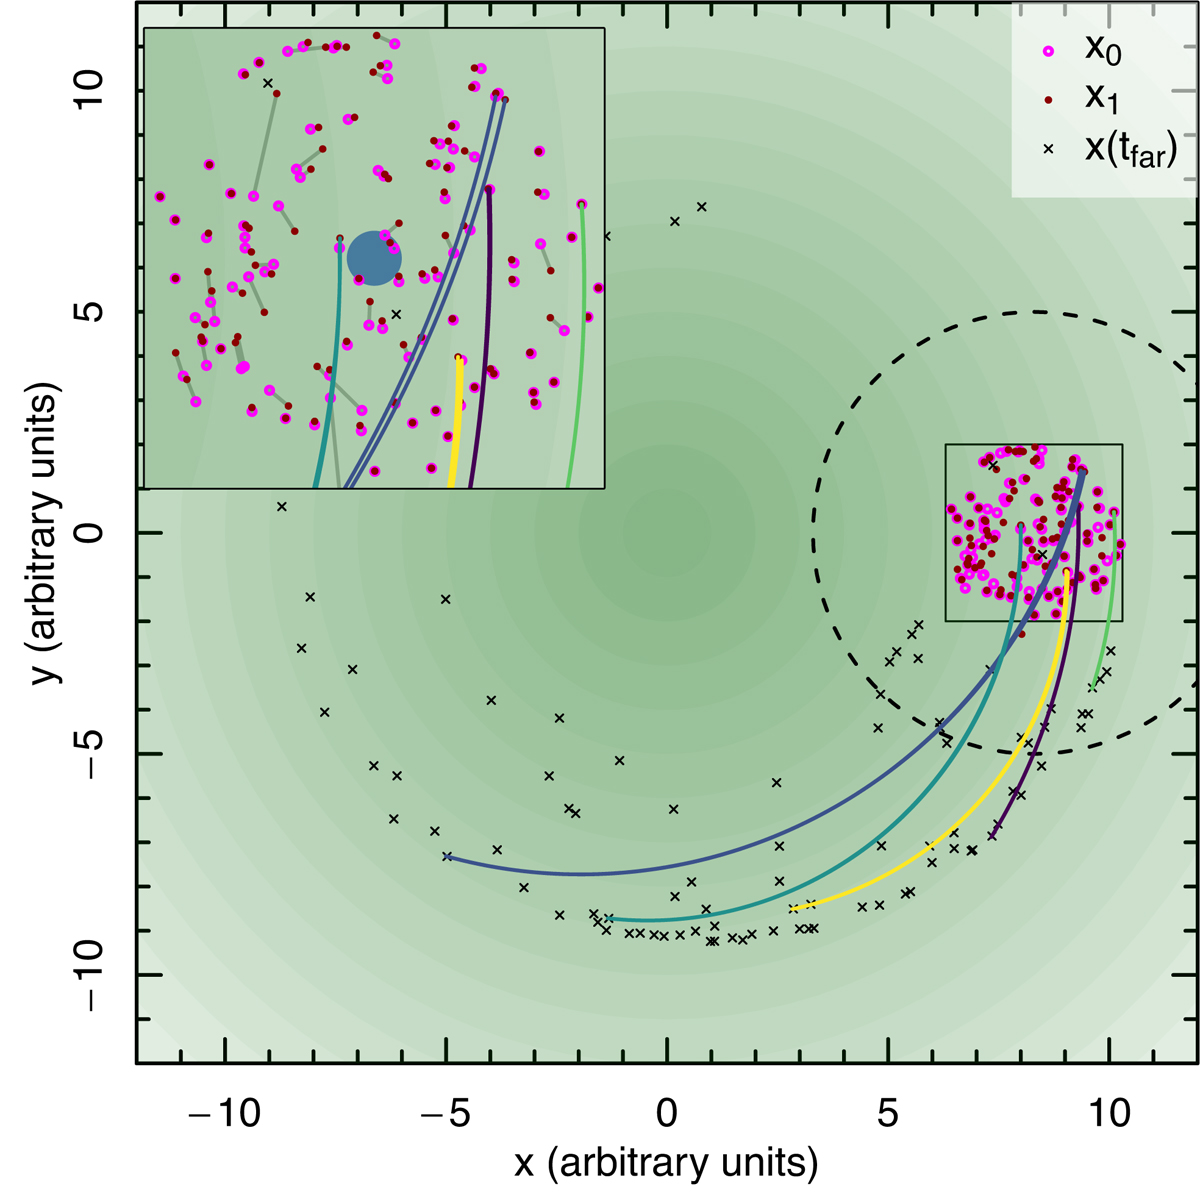
Fig. 1.
Download original image
Illustration of the dynamical friction framework. The magenta points describe the points of the host in the vicinity of a perturber (depicted as a blue dot in the enlarged sub-plot). Different coloured lines show a small sub-sample of integrated orbits, both backwards and forwards in time. The dashed circle shows the distance from the perturber where the tfar is reached. The acceleration field difference caused by unperturbed (x0) and perturbed (x1) points gives the dynamical friction. In the enlarged image, we connect the corresponding points with a grey line.
Current usage metrics show cumulative count of Article Views (full-text article views including HTML views, PDF and ePub downloads, according to the available data) and Abstracts Views on Vision4Press platform.
Data correspond to usage on the plateform after 2015. The current usage metrics is available 48-96 hours after online publication and is updated daily on week days.
Initial download of the metrics may take a while.