Fig. B.1
Download original image
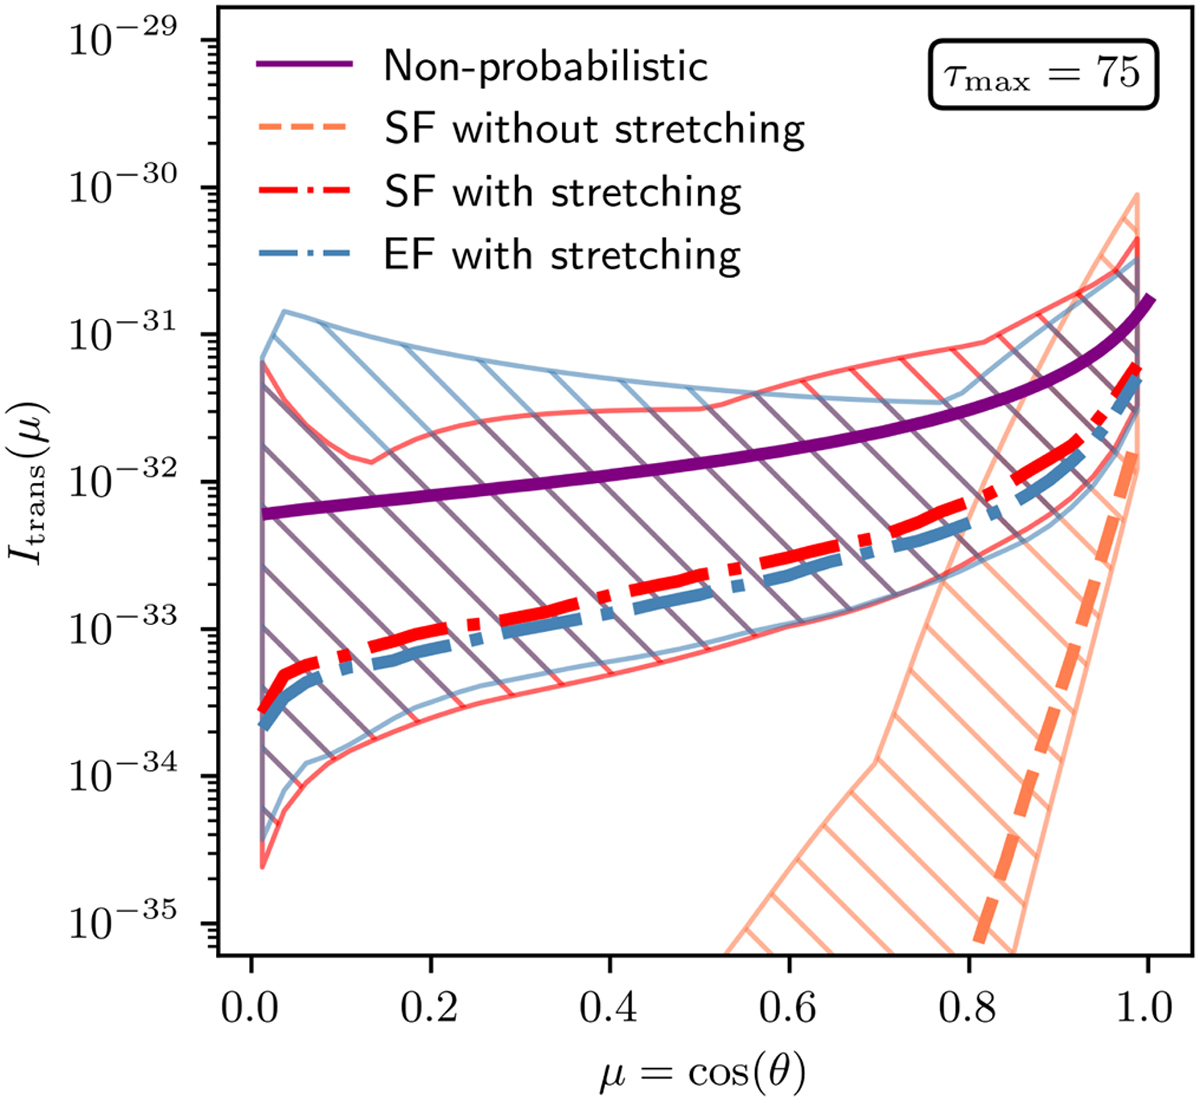
Transmission for τmax = 75. MC-based results comprise median transmission curves, each based on 100 peel-off-based individual simulations with N = 106 send out PPs per simulation. The hatched areas mark regions in the plot within which all 100 simulated transmission curves of the corresponding color lie. For details, see Sect. B.
Current usage metrics show cumulative count of Article Views (full-text article views including HTML views, PDF and ePub downloads, according to the available data) and Abstracts Views on Vision4Press platform.
Data correspond to usage on the plateform after 2015. The current usage metrics is available 48-96 hours after online publication and is updated daily on week days.
Initial download of the metrics may take a while.