Open Access
Fig. 4
Download original image
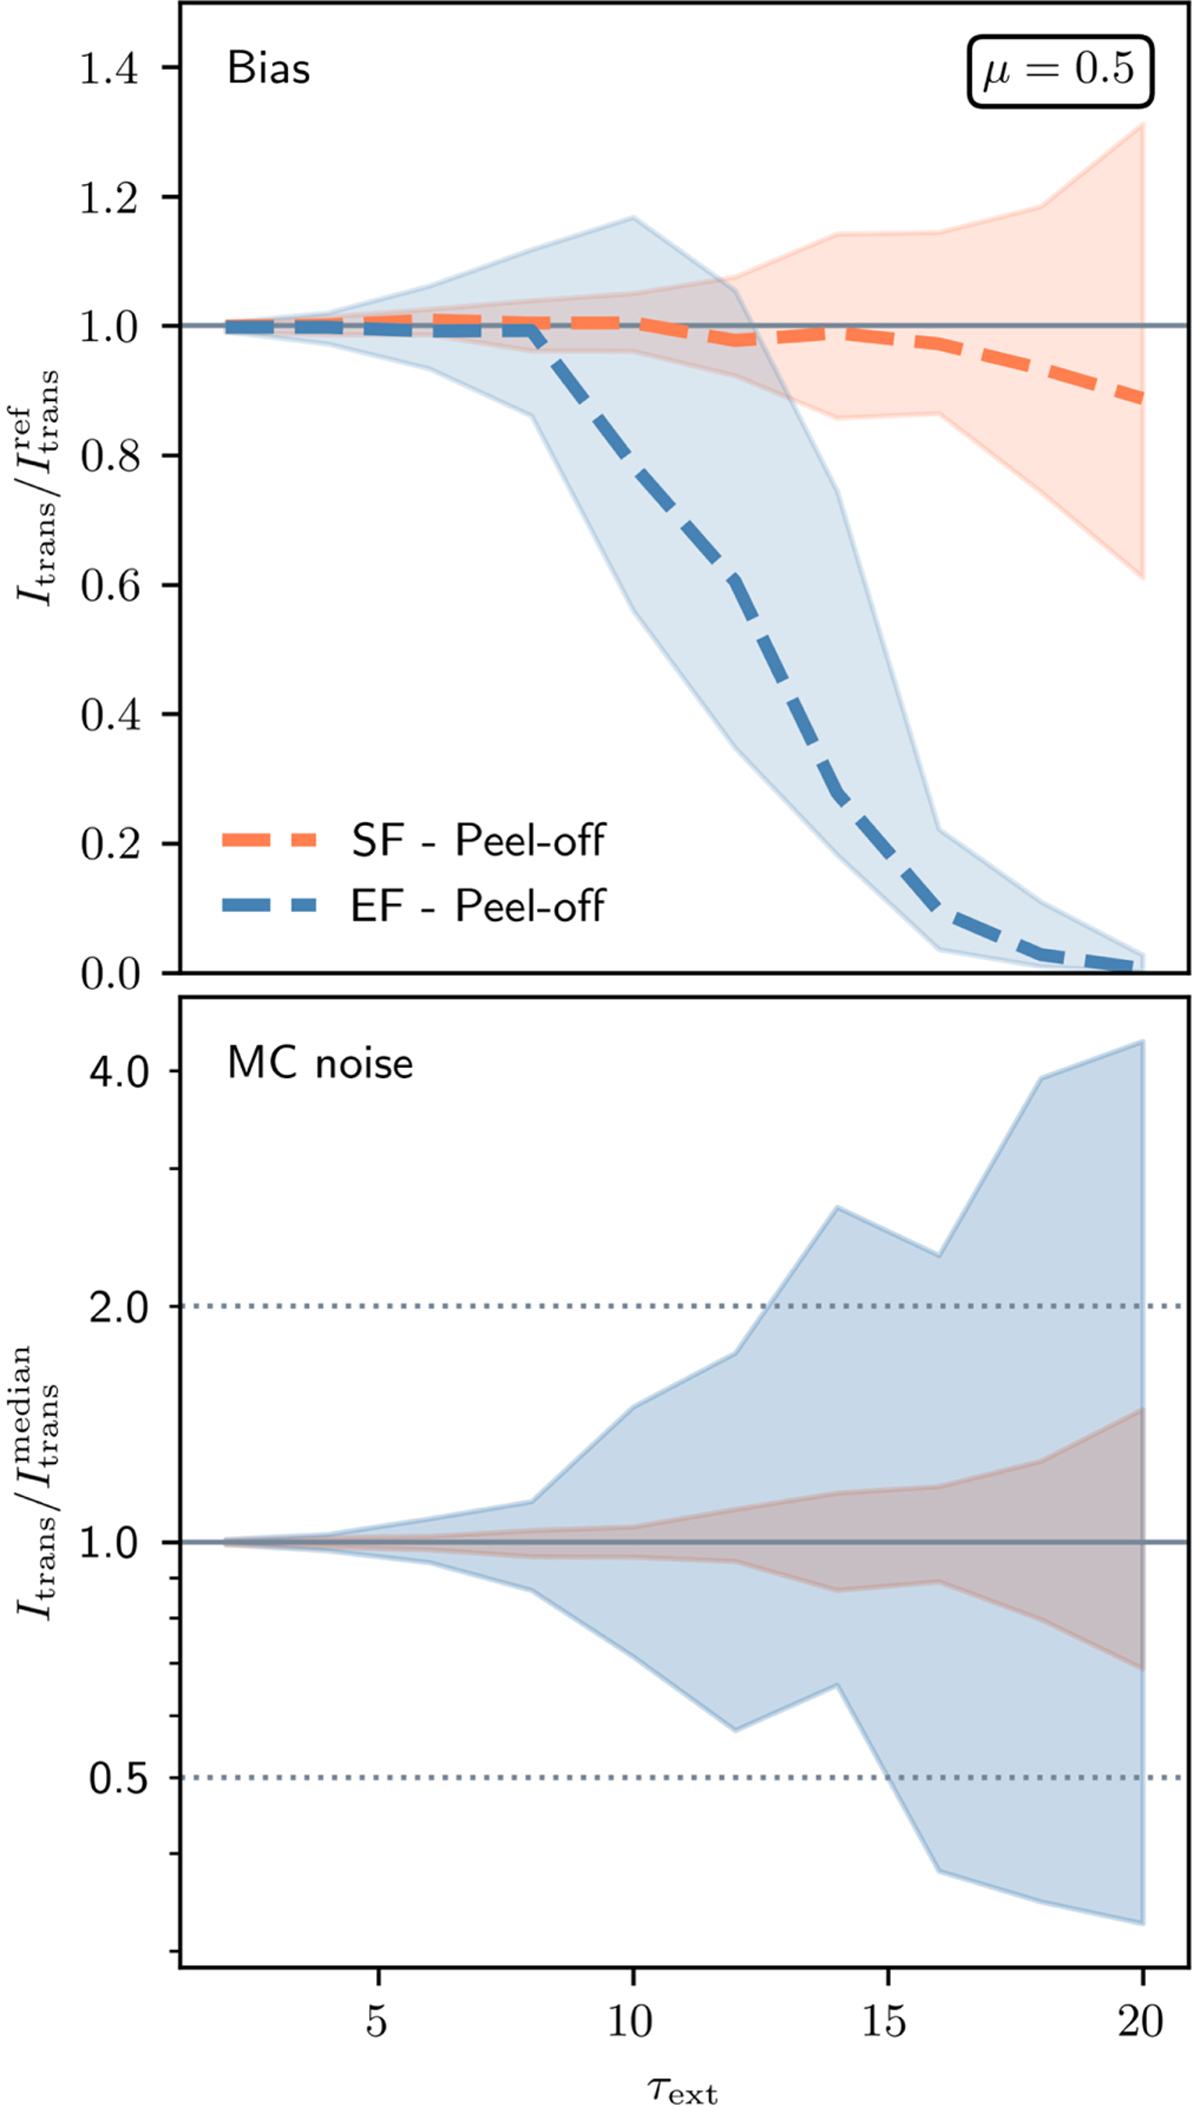
Bias (upper plot) and MC noise (lower plot) as a function of τmax. These results are based on 100 MCRT simulations each, and comprise median transmission curves (dashed lines) using N = 104 PPs and µ = 0.5. The shaded regions mark the region within which the central 50% of simulated values lie. For details, see Sect. 3.2.1.
Current usage metrics show cumulative count of Article Views (full-text article views including HTML views, PDF and ePub downloads, according to the available data) and Abstracts Views on Vision4Press platform.
Data correspond to usage on the plateform after 2015. The current usage metrics is available 48-96 hours after online publication and is updated daily on week days.
Initial download of the metrics may take a while.