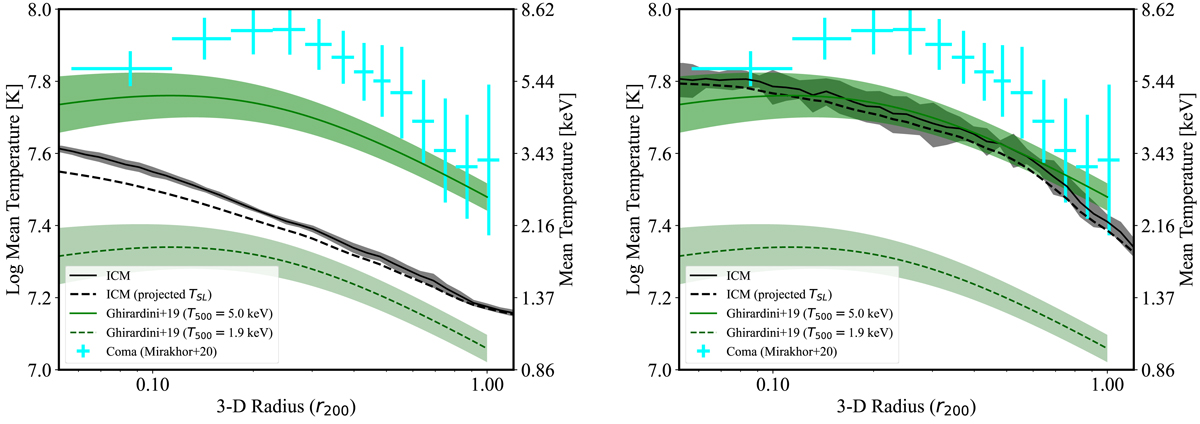
Fig. 7.
Download original image
Zoomed-in view of Fig. 6 for hot ICM temperature profiles and comparison with selected observations. TSL is the projected spectroscopic temperature according to the density-square weights of Mazzotta et al. (2004; uncertainty bands are similar to those of the 3D temperatures, and they are not shown). Left: All clusters. Right: Mass sample M3.
Current usage metrics show cumulative count of Article Views (full-text article views including HTML views, PDF and ePub downloads, according to the available data) and Abstracts Views on Vision4Press platform.
Data correspond to usage on the plateform after 2015. The current usage metrics is available 48-96 hours after online publication and is updated daily on week days.
Initial download of the metrics may take a while.