Fig. 5.
Download original image
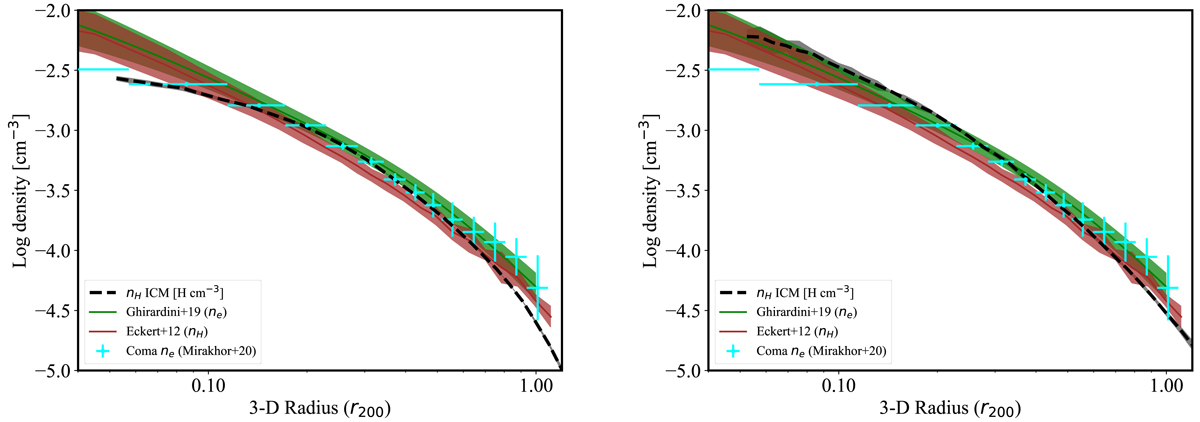
Zoomed-in view of Fig. 3, the median radial profiles of the mass density for the ICM gas phase for all the clusters (left panel), and the most massive ones (M3 mass bin, right panel). We highlight the comparison with X-COP observations (Ghirardini et al. 2019), those of a sample of 31 nearly clusters by Eckert et al. (2012), and the Coma cluster (Mirakhor & Walker 2020).
Current usage metrics show cumulative count of Article Views (full-text article views including HTML views, PDF and ePub downloads, according to the available data) and Abstracts Views on Vision4Press platform.
Data correspond to usage on the plateform after 2015. The current usage metrics is available 48-96 hours after online publication and is updated daily on week days.
Initial download of the metrics may take a while.