Open Access
Fig. 2.
Download original image
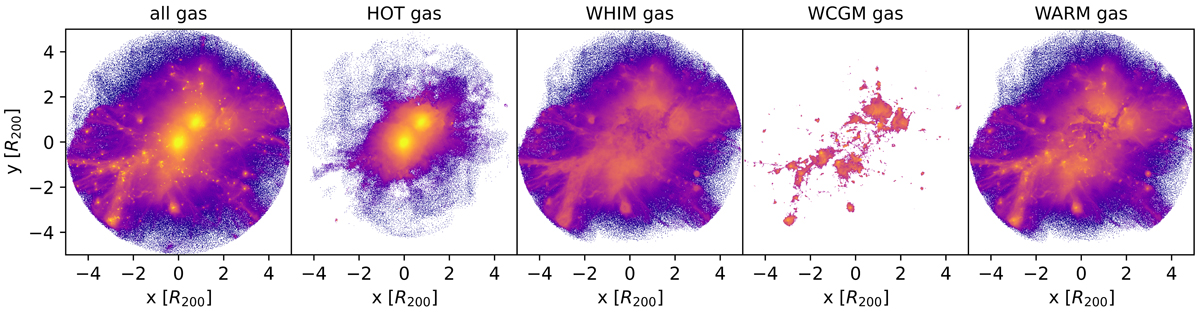
Distribution of gas within 5 R200 around a given massive cluster. The first panel shows the distribution of all the gas cells, the second one only the hot gas, the third one only the WHIM gas, and the left panel the WARM gas.
Current usage metrics show cumulative count of Article Views (full-text article views including HTML views, PDF and ePub downloads, according to the available data) and Abstracts Views on Vision4Press platform.
Data correspond to usage on the plateform after 2015. The current usage metrics is available 48-96 hours after online publication and is updated daily on week days.
Initial download of the metrics may take a while.