Open Access
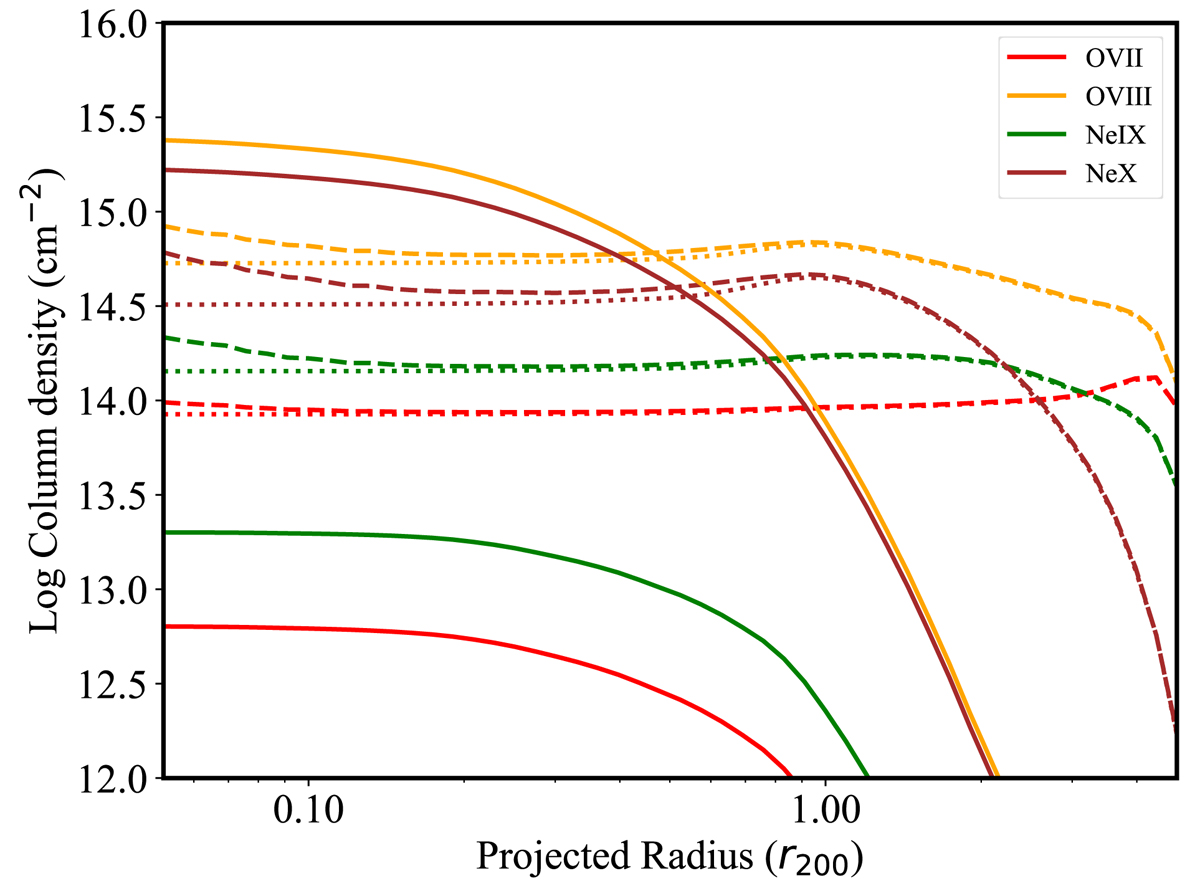
Fig. 17.
Download original image
Projected column densities of selected X-ray ions for all the clusters. Solid curves are for the hot gas phase, dashed curves for the WARM phase, and dotted curves for the WHIM phase.
Current usage metrics show cumulative count of Article Views (full-text article views including HTML views, PDF and ePub downloads, according to the available data) and Abstracts Views on Vision4Press platform.
Data correspond to usage on the plateform after 2015. The current usage metrics is available 48-96 hours after online publication and is updated daily on week days.
Initial download of the metrics may take a while.