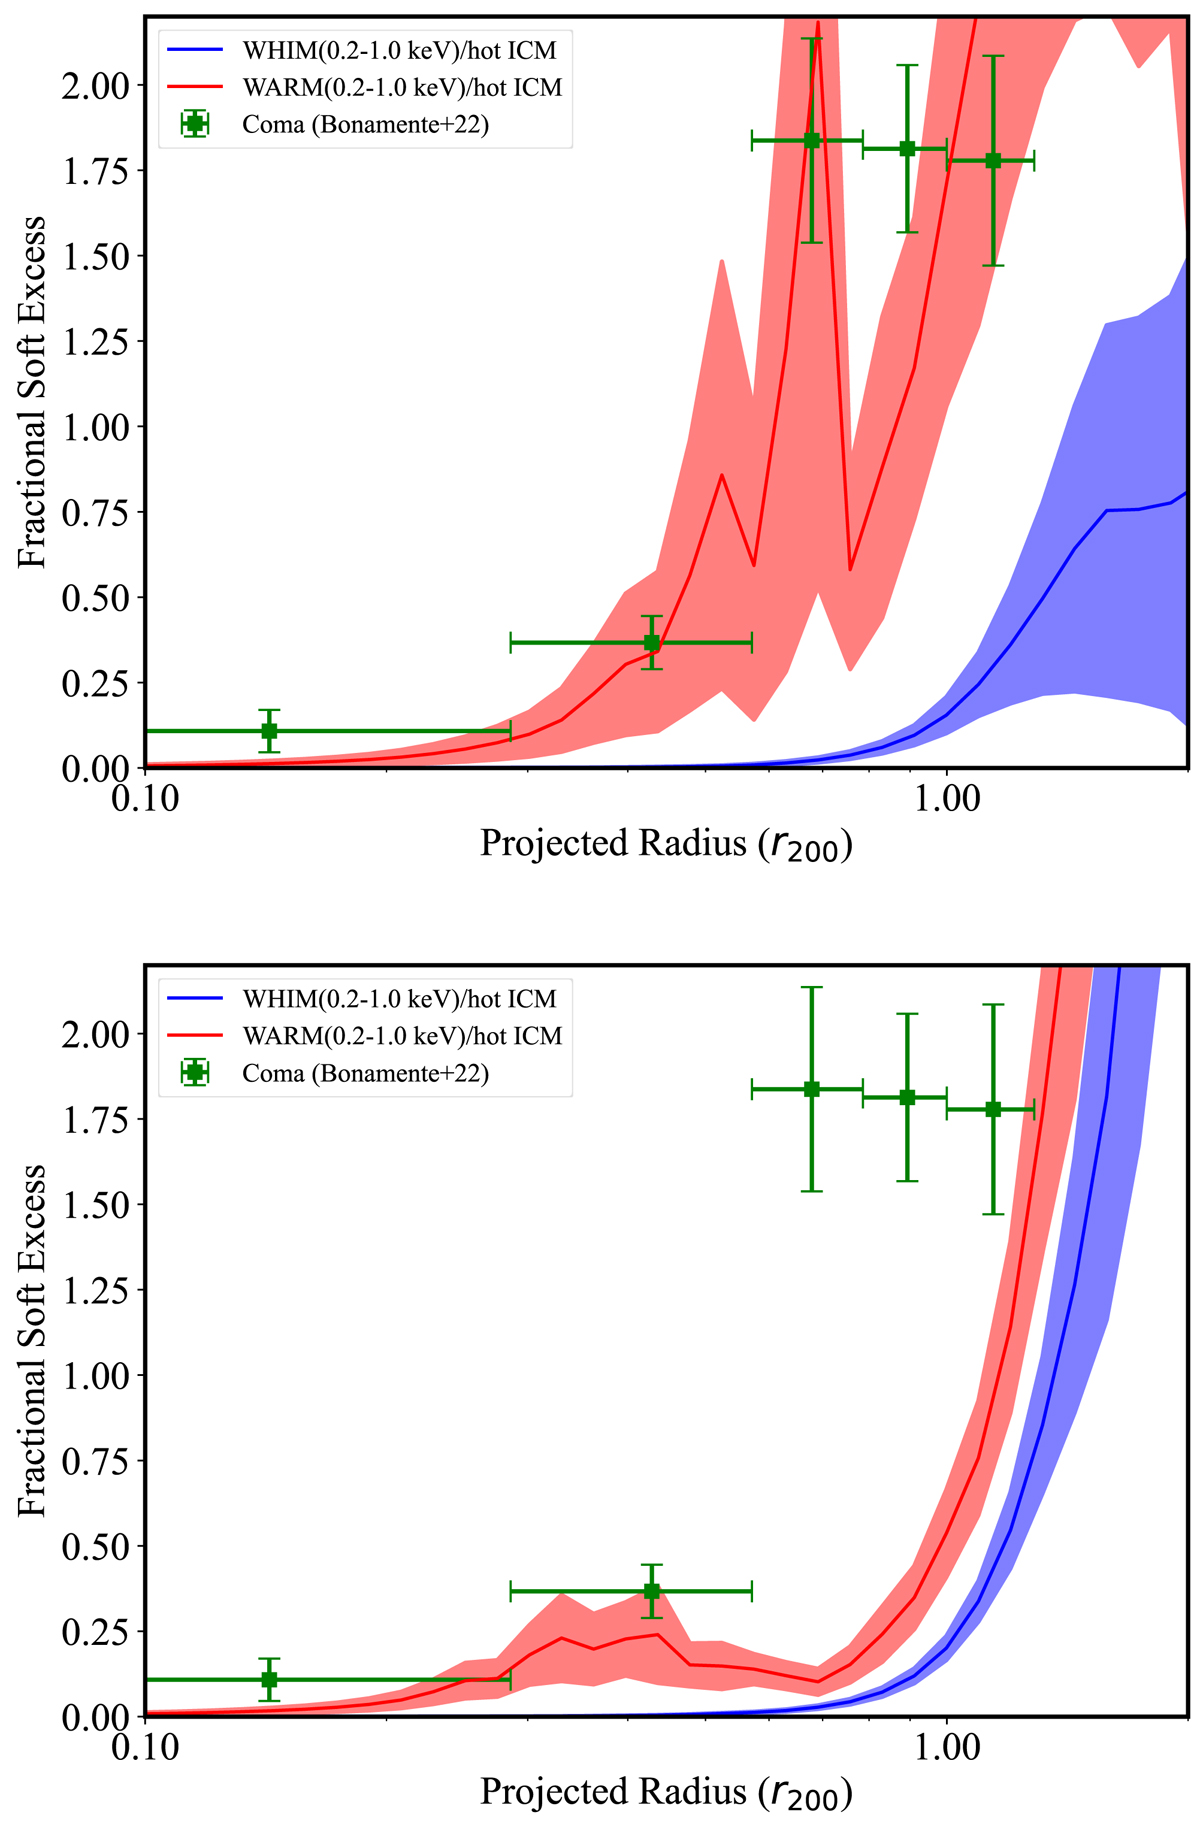
Fig. 16.
Download original image
Ratio of differential count rates from warm-hot phases, relative to the hot ICM. Same as in Fig. 14, but for the most massive clusters at M200 > 1014.75 M⊙ h−1 from sample M4 (top panel) to match the mass of the Coma cluster; and for the mass sample M3 (bottom panel). The data points are the soft excess emission measured by Bonamente et al. (2022) in the 0.2–1.0 keV band, based on the ROSAT analysis of Bonamente et al. (2003).
Current usage metrics show cumulative count of Article Views (full-text article views including HTML views, PDF and ePub downloads, according to the available data) and Abstracts Views on Vision4Press platform.
Data correspond to usage on the plateform after 2015. The current usage metrics is available 48-96 hours after online publication and is updated daily on week days.
Initial download of the metrics may take a while.