Open Access
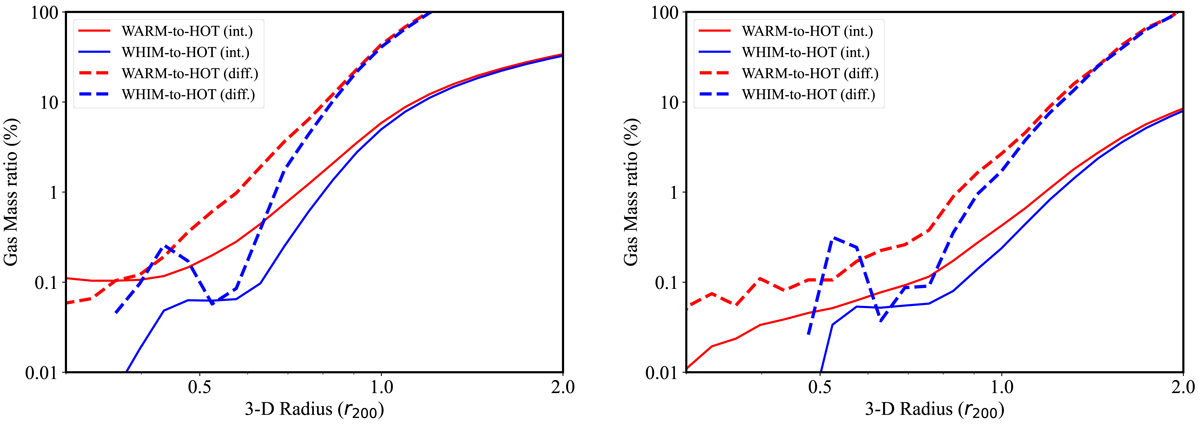
Fig. 15.
Download original image
Ratio of warm gas and WHIM masses relative to hot ICM mass, corresponding to the soft excess fluxes of Fig. 14. Left panel is for all clusters, and right is for mass sample M3. The solid curves represent the total integrated mass out to that radius.
Current usage metrics show cumulative count of Article Views (full-text article views including HTML views, PDF and ePub downloads, according to the available data) and Abstracts Views on Vision4Press platform.
Data correspond to usage on the plateform after 2015. The current usage metrics is available 48-96 hours after online publication and is updated daily on week days.
Initial download of the metrics may take a while.