Open Access
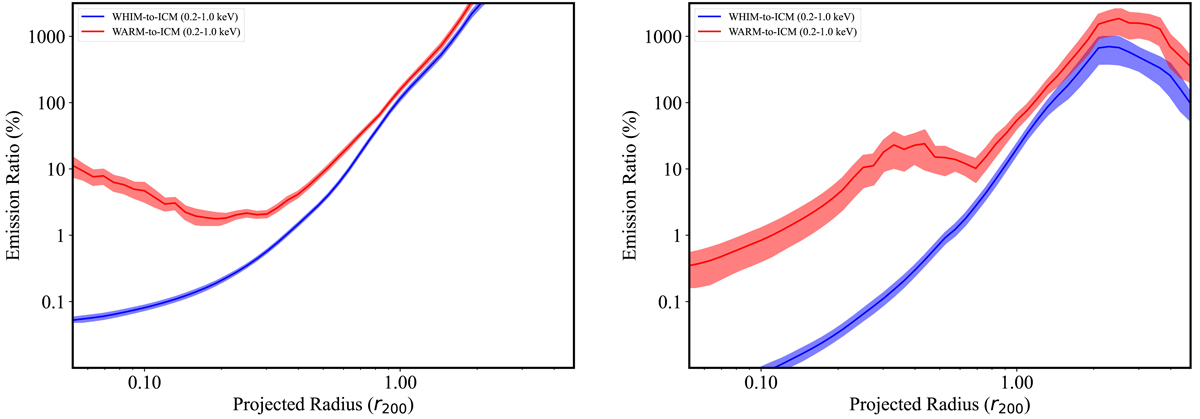
Fig. 14.
Download original image
Ratios of differential X-ray surface brightness or count rates of warm phases, relative to the hot ICM; left panel for all clusters and right for mass sample M3. The figure also shows the contribution of individual ions, primarily through their line emission, to the total emission from warm sub-virial phases.
Current usage metrics show cumulative count of Article Views (full-text article views including HTML views, PDF and ePub downloads, according to the available data) and Abstracts Views on Vision4Press platform.
Data correspond to usage on the plateform after 2015. The current usage metrics is available 48-96 hours after online publication and is updated daily on week days.
Initial download of the metrics may take a while.