Fig. 7.
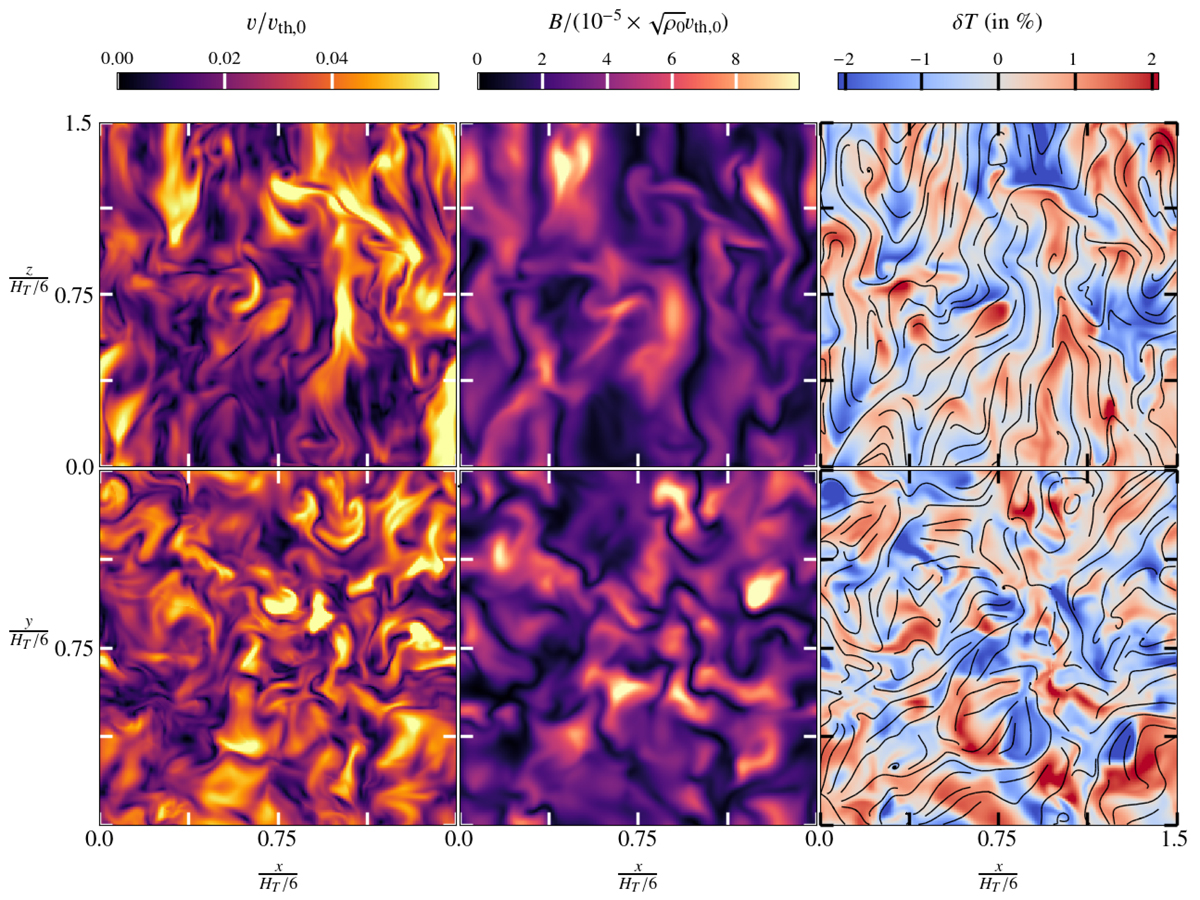
Download original image
Snapshots of MTI turbulent fields at t = 100t0. Top: vertical (x, z) cuts at y = 0.75. Bottom: horizontal (x, y) cuts at z = 0.75. From left to right: norm of the velocity and magnetic fields (in code units) and temperature fluctuations (in % of the background temperature T(z), Eq. (3)). Magnetic field lines are superimposed as black lines on the temperature fluctuations.
Current usage metrics show cumulative count of Article Views (full-text article views including HTML views, PDF and ePub downloads, according to the available data) and Abstracts Views on Vision4Press platform.
Data correspond to usage on the plateform after 2015. The current usage metrics is available 48-96 hours after online publication and is updated daily on week days.
Initial download of the metrics may take a while.