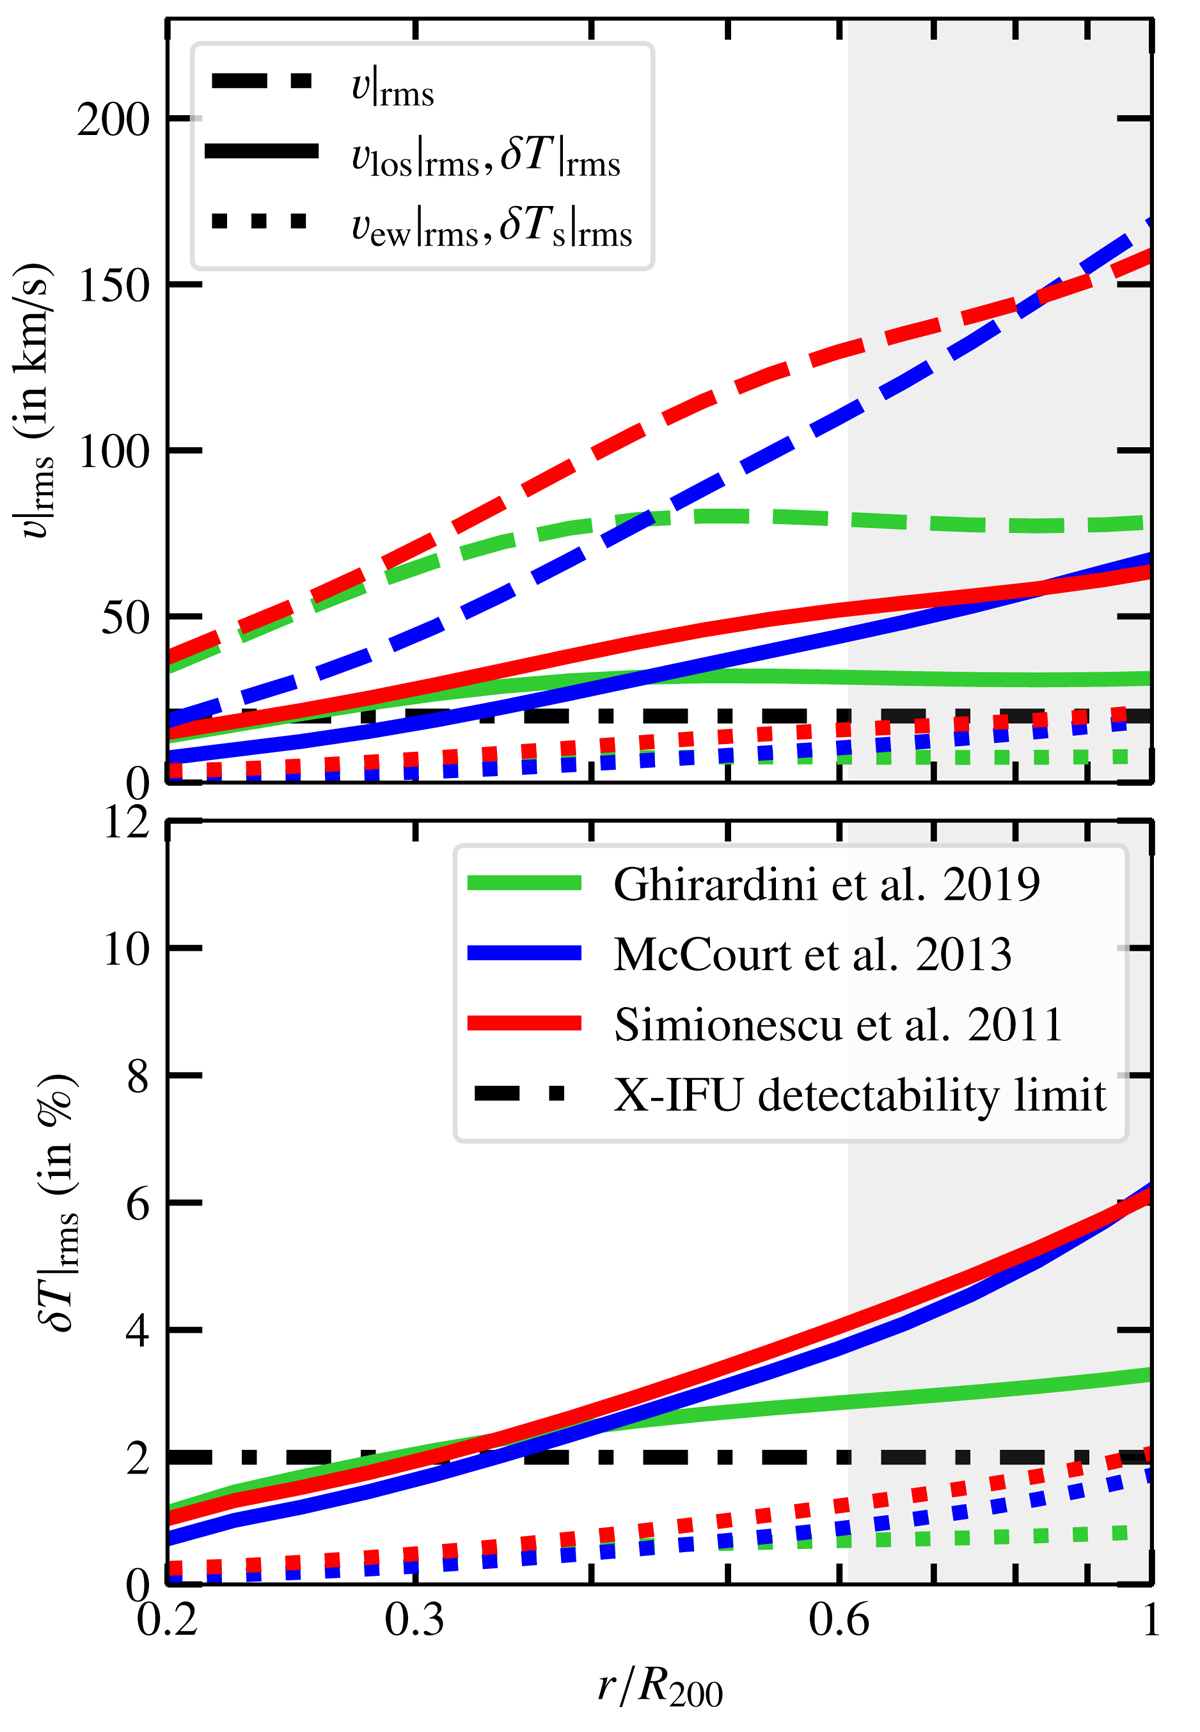
Fig. 5.
Download original image
Intensity levels of MTI turbulence. Dashed line: root-mean square of the 3D turbulent velocity field as a function of the radius in the ICM. Full line: root-mean square of the 3D turbulent line-of-sight velocity (top) and temperature (bottom) fluctuations. Dotted line: same but for the estimated 2D projected quantities after integration along the line of sight. The dash-dotted black lines are X-IFU detectability limits (determined in Sect. 4) for a typical 2-Ms observation of a Perseus-like cluster at 0.25R200. The colour encoding follows Fig. 1.
Current usage metrics show cumulative count of Article Views (full-text article views including HTML views, PDF and ePub downloads, according to the available data) and Abstracts Views on Vision4Press platform.
Data correspond to usage on the plateform after 2015. The current usage metrics is available 48-96 hours after online publication and is updated daily on week days.
Initial download of the metrics may take a while.