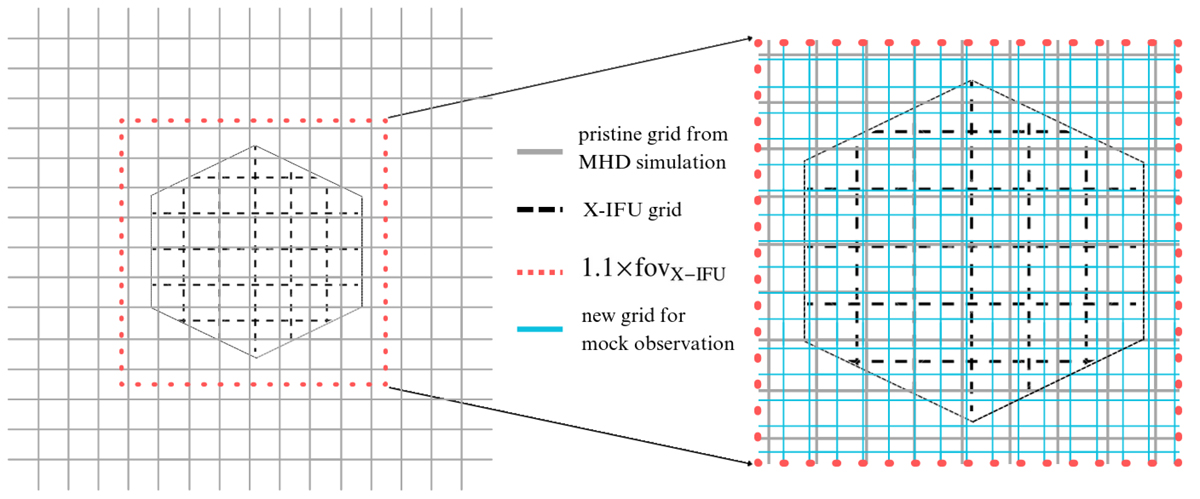
Fig. C.1.
Download original image
Schematic of the different grids used in the observational pipeline. The relative sizes of the grids are consistent with respect to each other: there is almost one cell from the MHD simulation grid (full grey lines, left), after rescaling of the box as in OBScustom, in a X-IFU pixel (black dashed lines, left) and there are ∼4 cells of the finer grid (light blue lines, right), refined from the MHD simulation grid within the dotted red square and used for the synthetic observation, in a pixel of X-IFU. For the sake of clarity, the absolute sizes of the grids are however not to scale. For instance, there should be 3168 pixels in X-IFU’s hexagon (in our baseline instrumental configuration) instead of ∼30 on the schema, in which X-IFU border pixels are not squared whereas they should be as well in reality.
Current usage metrics show cumulative count of Article Views (full-text article views including HTML views, PDF and ePub downloads, according to the available data) and Abstracts Views on Vision4Press platform.
Data correspond to usage on the plateform after 2015. The current usage metrics is available 48-96 hours after online publication and is updated daily on week days.
Initial download of the metrics may take a while.