Fig. 10.
Download original image
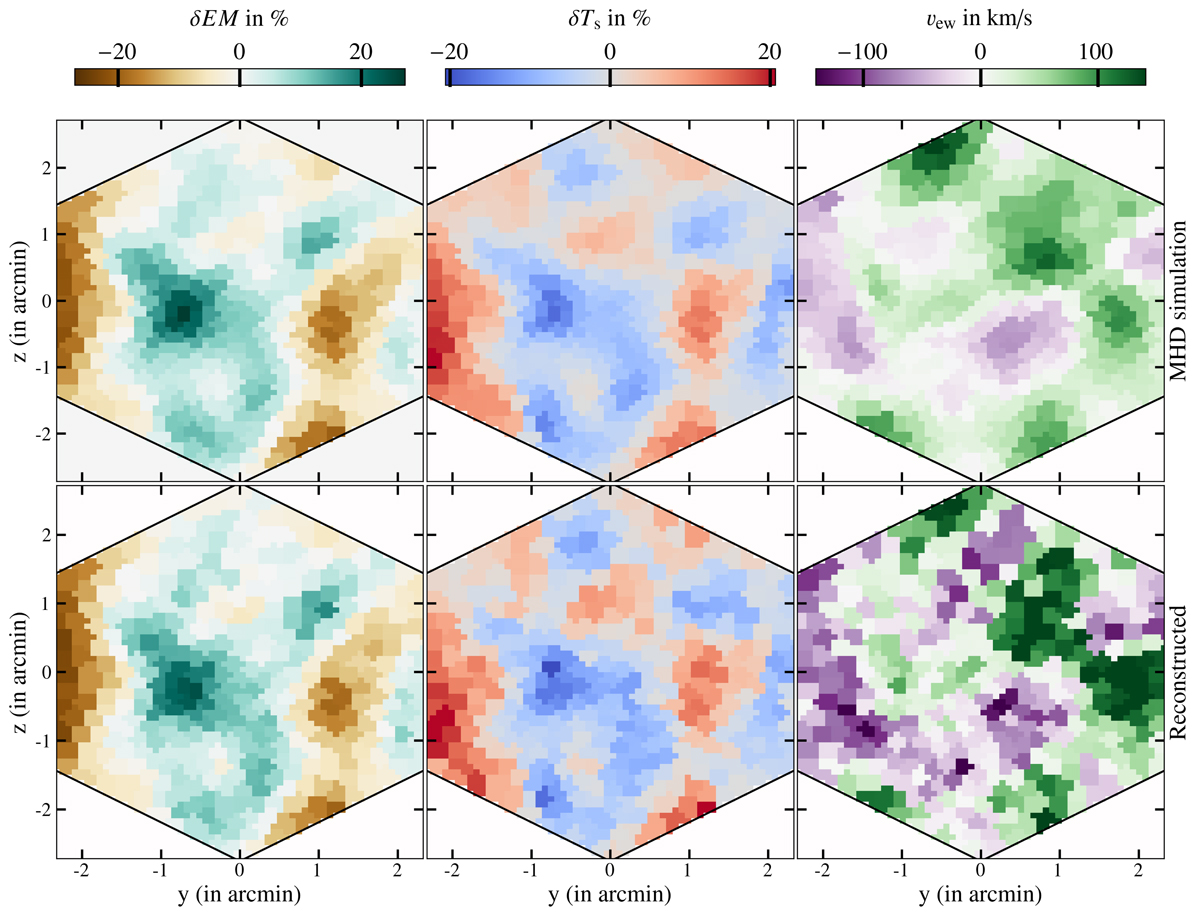
Custom synthetic observation OBScustom (at 0.25 R200 with Perseus density profile), based on the optimally custom-rescaled Braginskii-MHD simulation. From left to right: emission measure fluctuation δEM, spectroscopic temperature fluctuation δTs and emission-weighted velocity vew maps. Top: line-of-sight integrated input fields from the rescaled MHD simulation. Bottom: output fields reconstructed from the synthetic observation OBScustom. The colourbars are set according to the input quantities. The values of the thermodynamic fluctuation fields are in percents of the average background quantities (see Eq. (E.3)).
Current usage metrics show cumulative count of Article Views (full-text article views including HTML views, PDF and ePub downloads, according to the available data) and Abstracts Views on Vision4Press platform.
Data correspond to usage on the plateform after 2015. The current usage metrics is available 48-96 hours after online publication and is updated daily on week days.
Initial download of the metrics may take a while.