Fig. 1.
Download original image
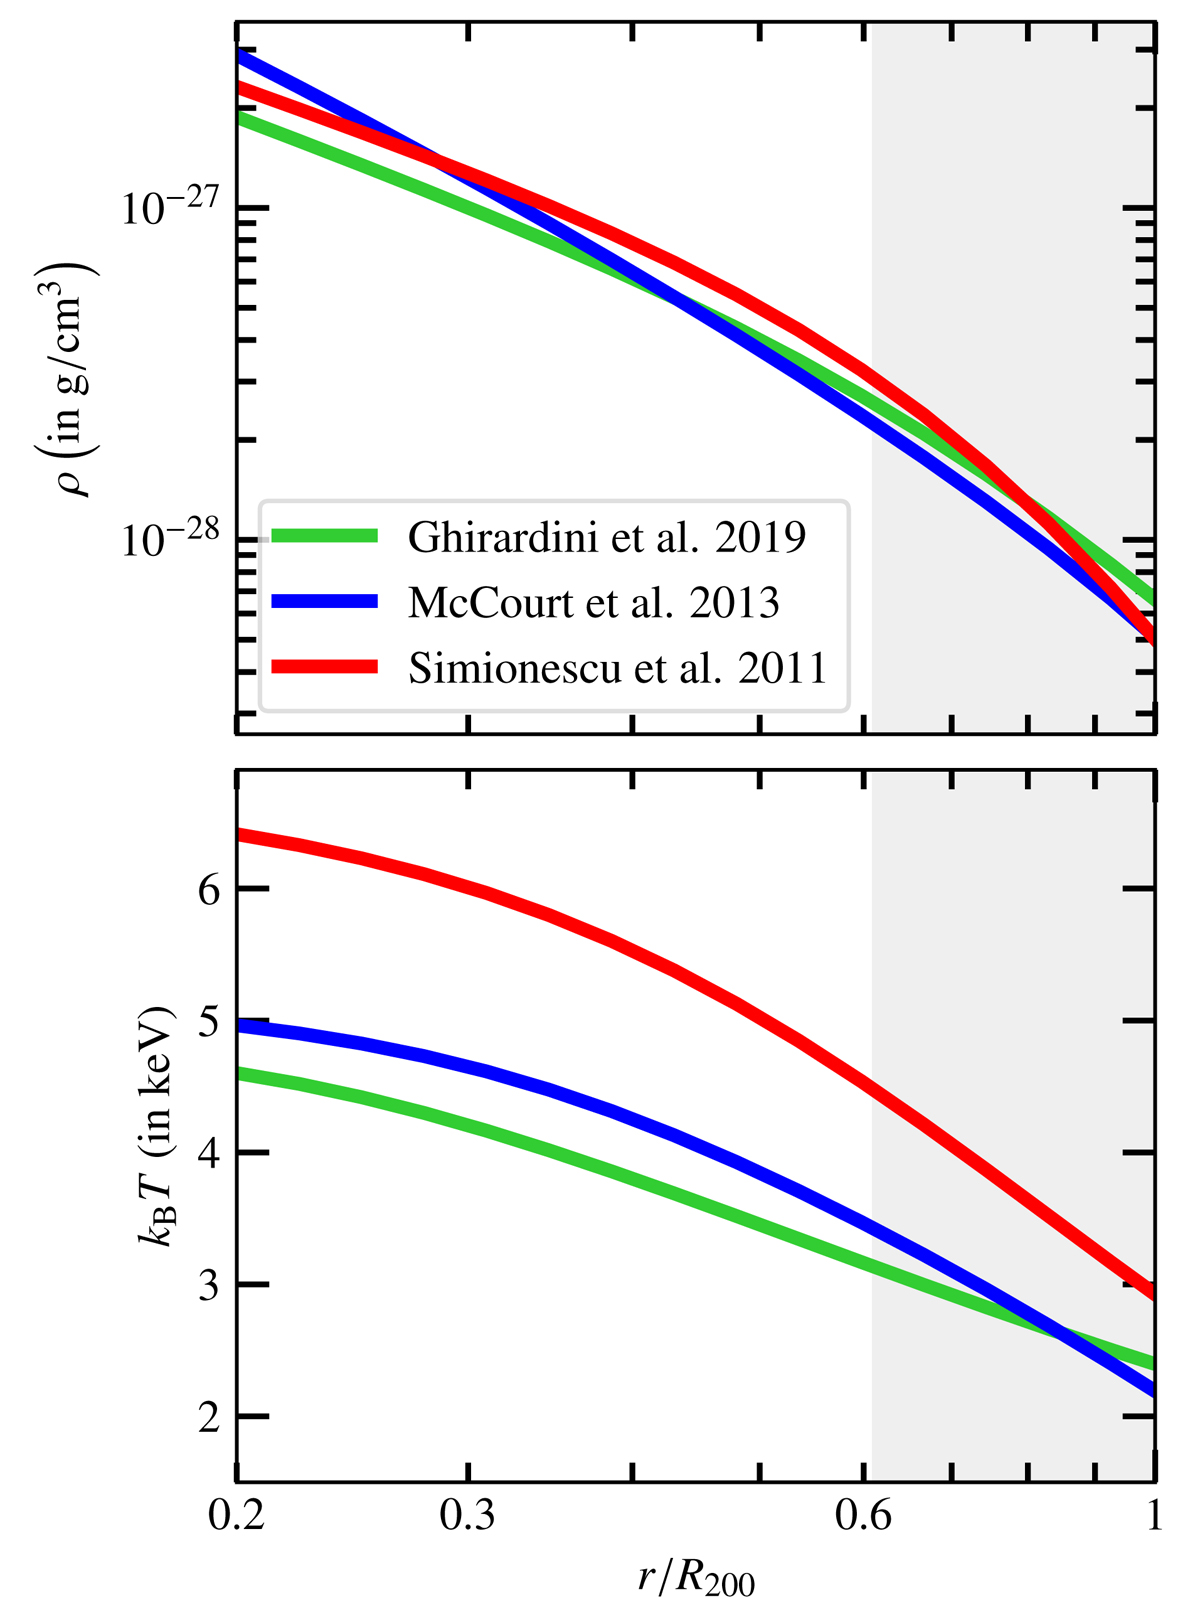
Density ρ (top) and temperature T (bottom) profiles as a function of radius for three typical ICM models (Ghirardini et al. 2019; McCourt et al. 2013; Simionescu et al. 2011). Only the range with decreasing temperature is shown, until R200. The grey shaded areas highlight radii for which the X-IFU will collect less than two million photons in the 0.2–12 keV energy range during a 2-Ms observation.
Current usage metrics show cumulative count of Article Views (full-text article views including HTML views, PDF and ePub downloads, according to the available data) and Abstracts Views on Vision4Press platform.
Data correspond to usage on the plateform after 2015. The current usage metrics is available 48-96 hours after online publication and is updated daily on week days.
Initial download of the metrics may take a while.