Open Access
Fig. 7.
Download original image
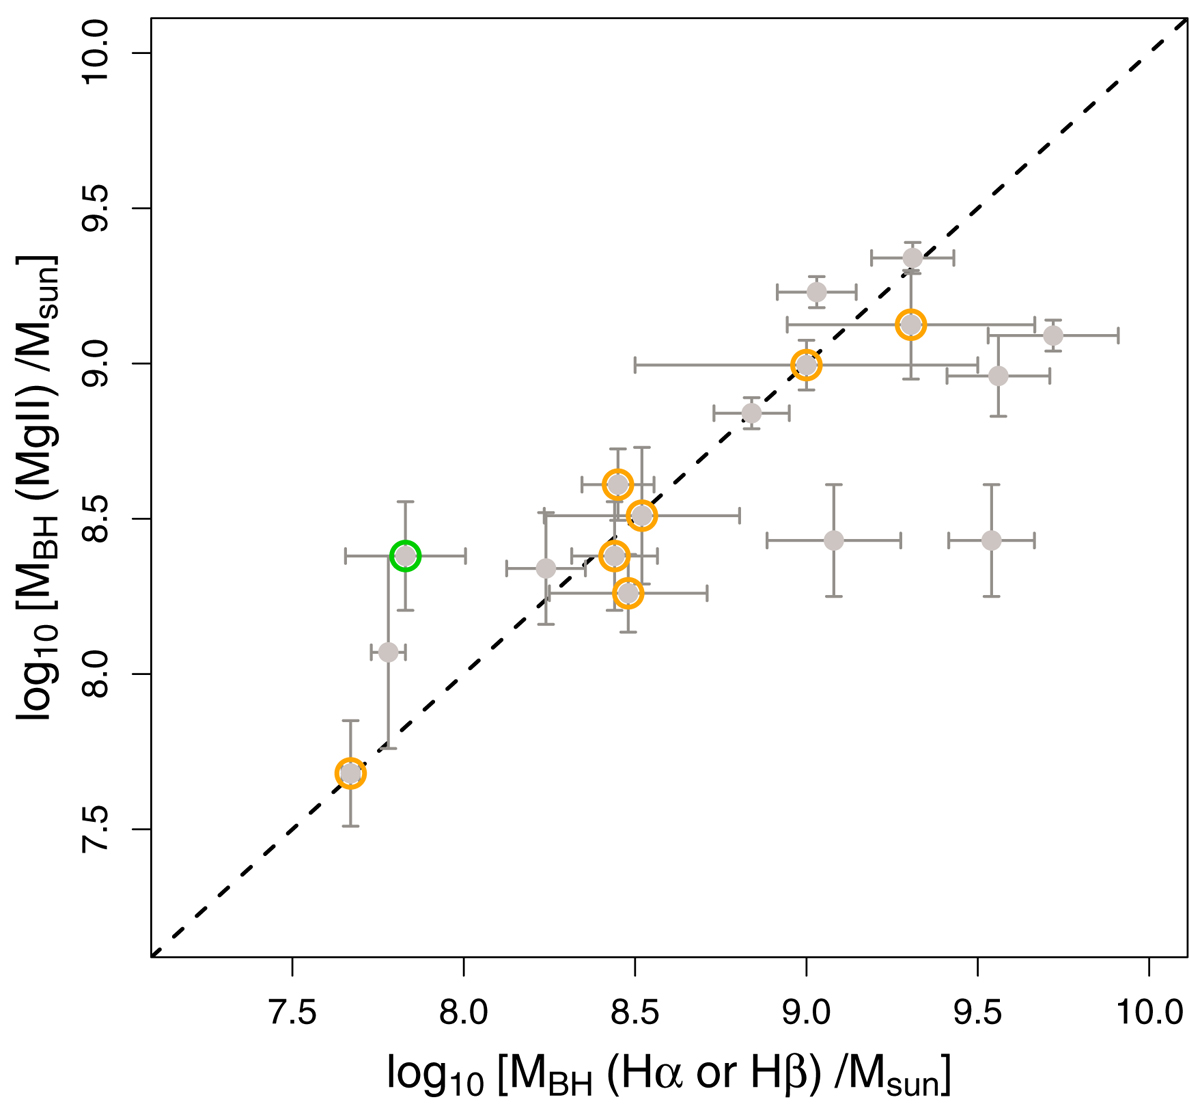
Comparison between MBH estimates obtained from the Balmer lines and MgII emission lines. The new measurements are marked in orange (Hα emission line) and green (Hβ emission line). The systematic offset from Mejía-Restrepo et al. (2016) is applied. The dotted line shows where the masses are equal.
Current usage metrics show cumulative count of Article Views (full-text article views including HTML views, PDF and ePub downloads, according to the available data) and Abstracts Views on Vision4Press platform.
Data correspond to usage on the plateform after 2015. The current usage metrics is available 48-96 hours after online publication and is updated daily on week days.
Initial download of the metrics may take a while.