Fig. 9
Download original image
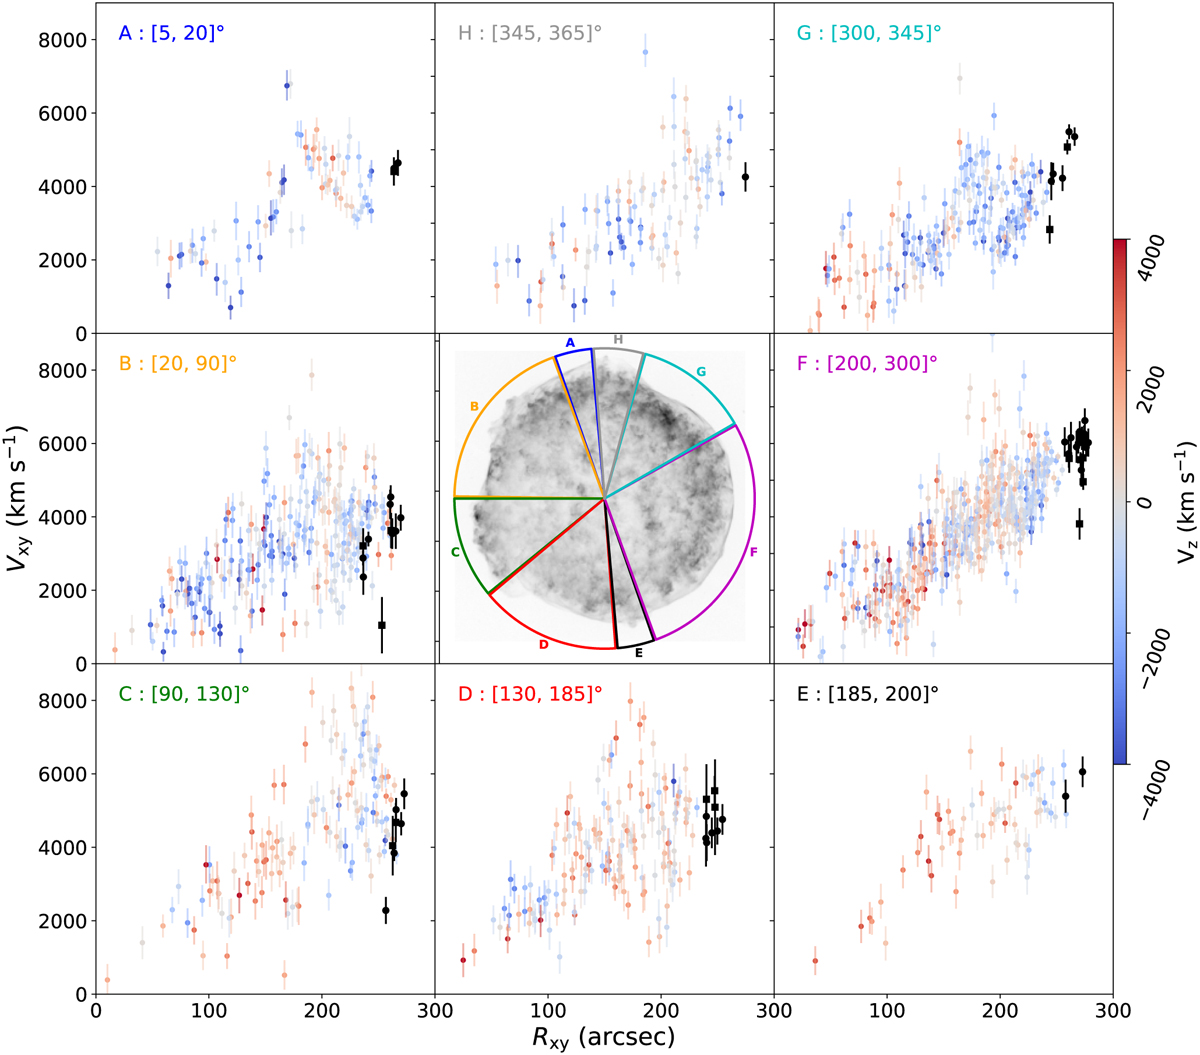
Profiles of the proper motion, Vxy, as a function of the radius in the plane of the sky, Rxy, for eight angular sectors. In the central panel, sectors are overlaid on the 0.5–7 keV Chandra map from the deep 2009 observations. The color red/blue is the velocity Vz of our map in Fig. 4, in the same position as the POF measurements in Fig. 6. We add on the profiles the forward shock velocity measurements from Katsuda et al. (2010) in black circles and Williams et al. (2016) in black squares that are located in the associated sector.
Current usage metrics show cumulative count of Article Views (full-text article views including HTML views, PDF and ePub downloads, according to the available data) and Abstracts Views on Vision4Press platform.
Data correspond to usage on the plateform after 2015. The current usage metrics is available 48-96 hours after online publication and is updated daily on week days.
Initial download of the metrics may take a while.