Fig. 4
Download original image
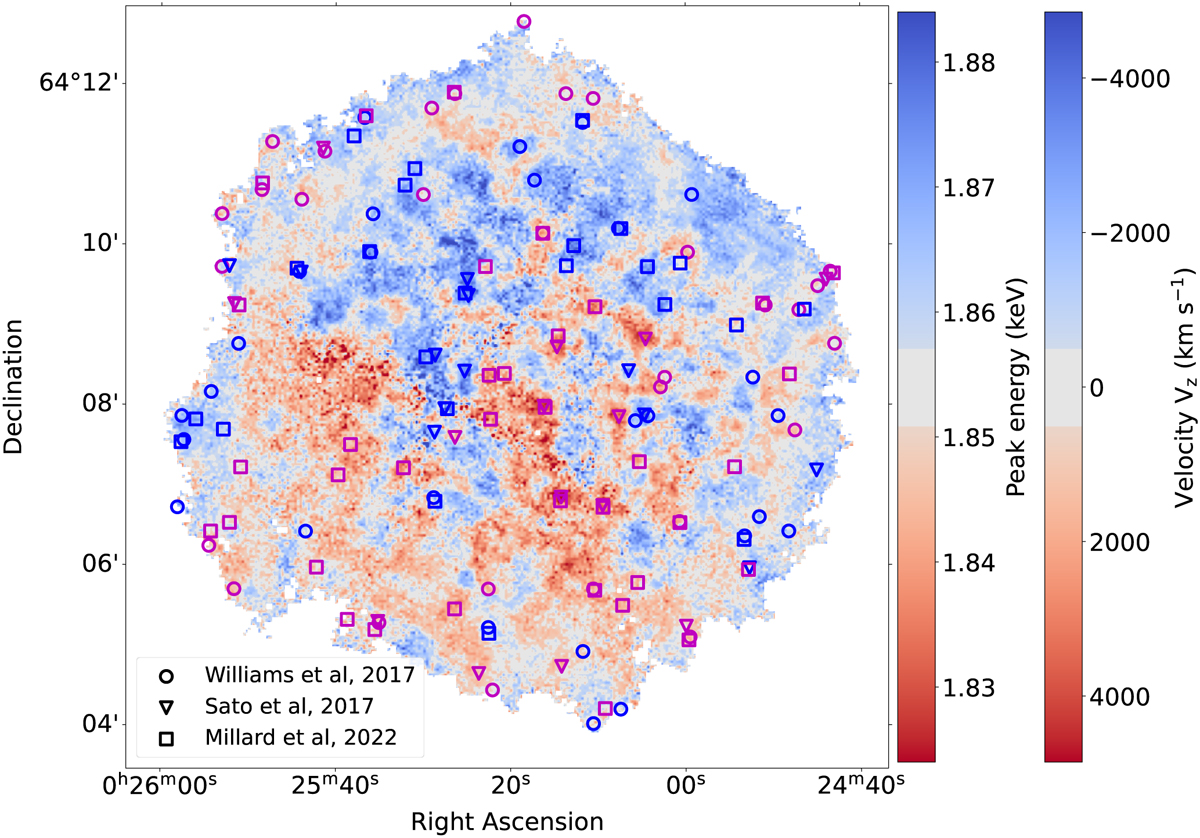
Map of the peak energy reconstructed with GMCA components and its equivalence in terms of integrated velocity in the LoS. The markers are the measurements from Williams et al. (2017) shown as circles, Sato & Hughes (2017a), shown as triangles, and Millard et al. (2022) shown as squares. Their colors (blueshifted or redshifted) come from their results.
Current usage metrics show cumulative count of Article Views (full-text article views including HTML views, PDF and ePub downloads, according to the available data) and Abstracts Views on Vision4Press platform.
Data correspond to usage on the plateform after 2015. The current usage metrics is available 48-96 hours after online publication and is updated daily on week days.
Initial download of the metrics may take a while.