Fig. 2
Download original image
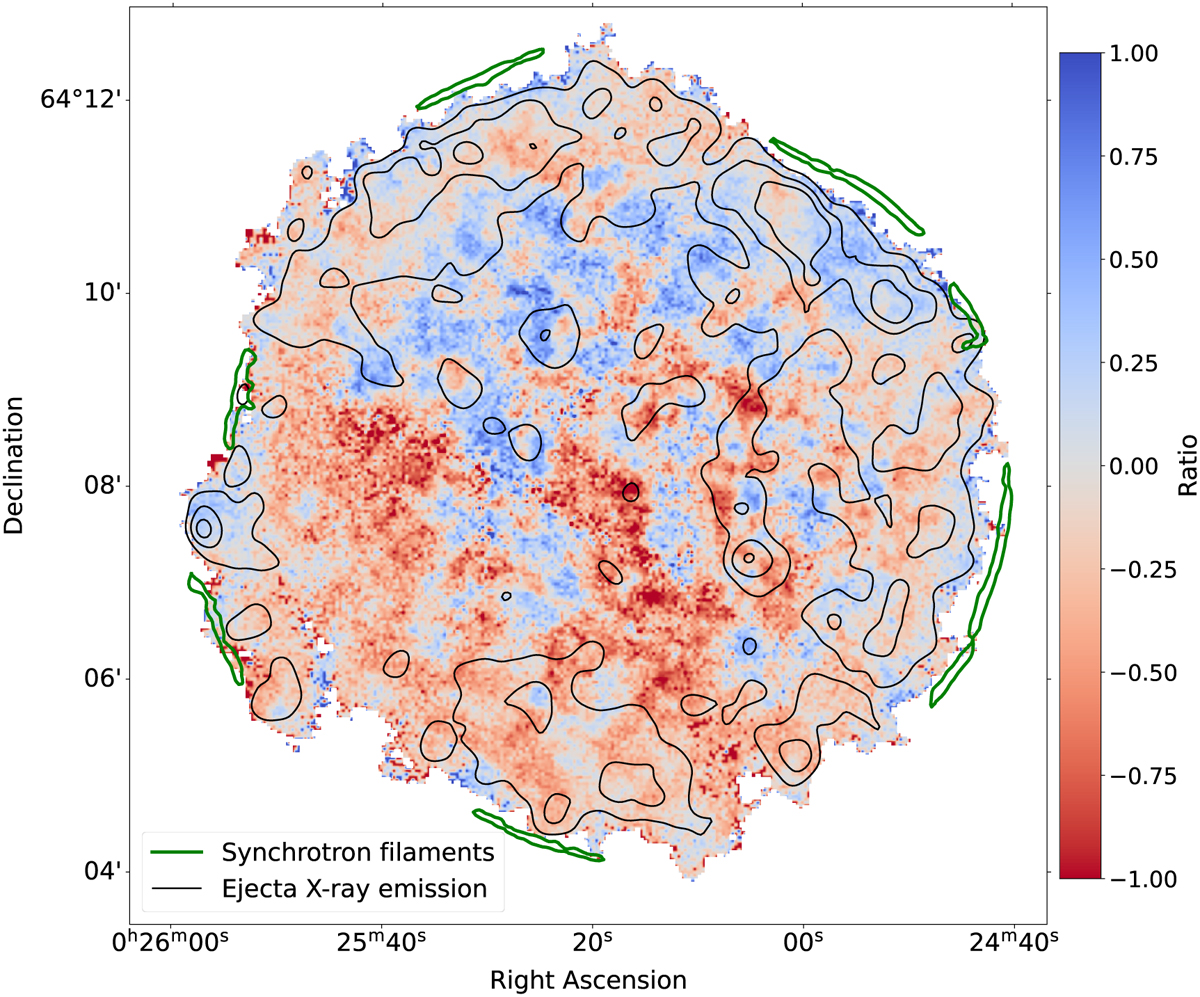
Ratio map (see Eq. (3)) of the red and blueshifted GMCA images. For example, a pixel with a value of 1 is dominated by the blueshifted GMCA image. The main synchrotron filaments are indicated in green, found with a contour detector in the first GMCA component. The dark contours come from the total image of the SNR in the 1.6–2.1 keV band smoothed by a 5 arcsec Gaussian kernel.
Current usage metrics show cumulative count of Article Views (full-text article views including HTML views, PDF and ePub downloads, according to the available data) and Abstracts Views on Vision4Press platform.
Data correspond to usage on the plateform after 2015. The current usage metrics is available 48-96 hours after online publication and is updated daily on week days.
Initial download of the metrics may take a while.