Fig. B.1
Download original image
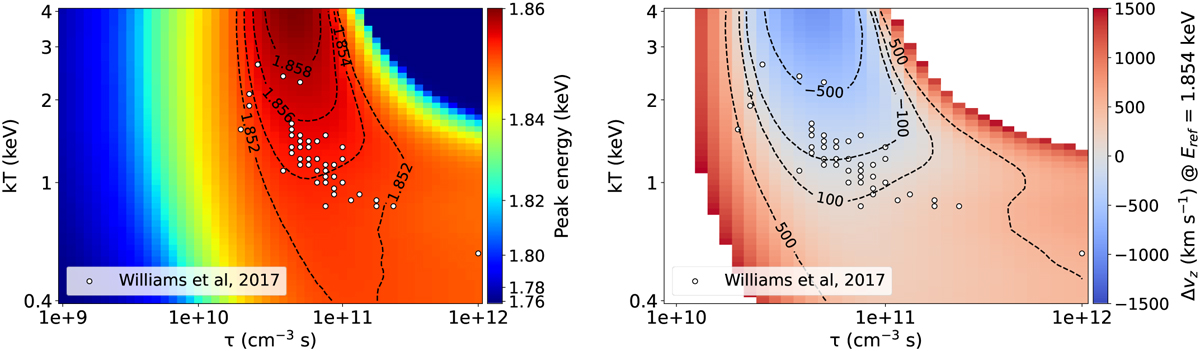
Impact of the local conditions of temperature and ionization timescale on the energy at rest of the silicon line used to obtain the velocity in the LoS, Vz.
Left: Background map is the theoretical peak energy of the silicon line in the (kT, τ) space with contours in black. This is compared with the kT and τ local spectral measurements from Williams et al. (2017). Right: Assuming a LoS velocity of 4000 km s−1, these panels show the associated velocity uncertainty if the energy of reference changes due temperature and ionization timescale variations.
Current usage metrics show cumulative count of Article Views (full-text article views including HTML views, PDF and ePub downloads, according to the available data) and Abstracts Views on Vision4Press platform.
Data correspond to usage on the plateform after 2015. The current usage metrics is available 48-96 hours after online publication and is updated daily on week days.
Initial download of the metrics may take a while.