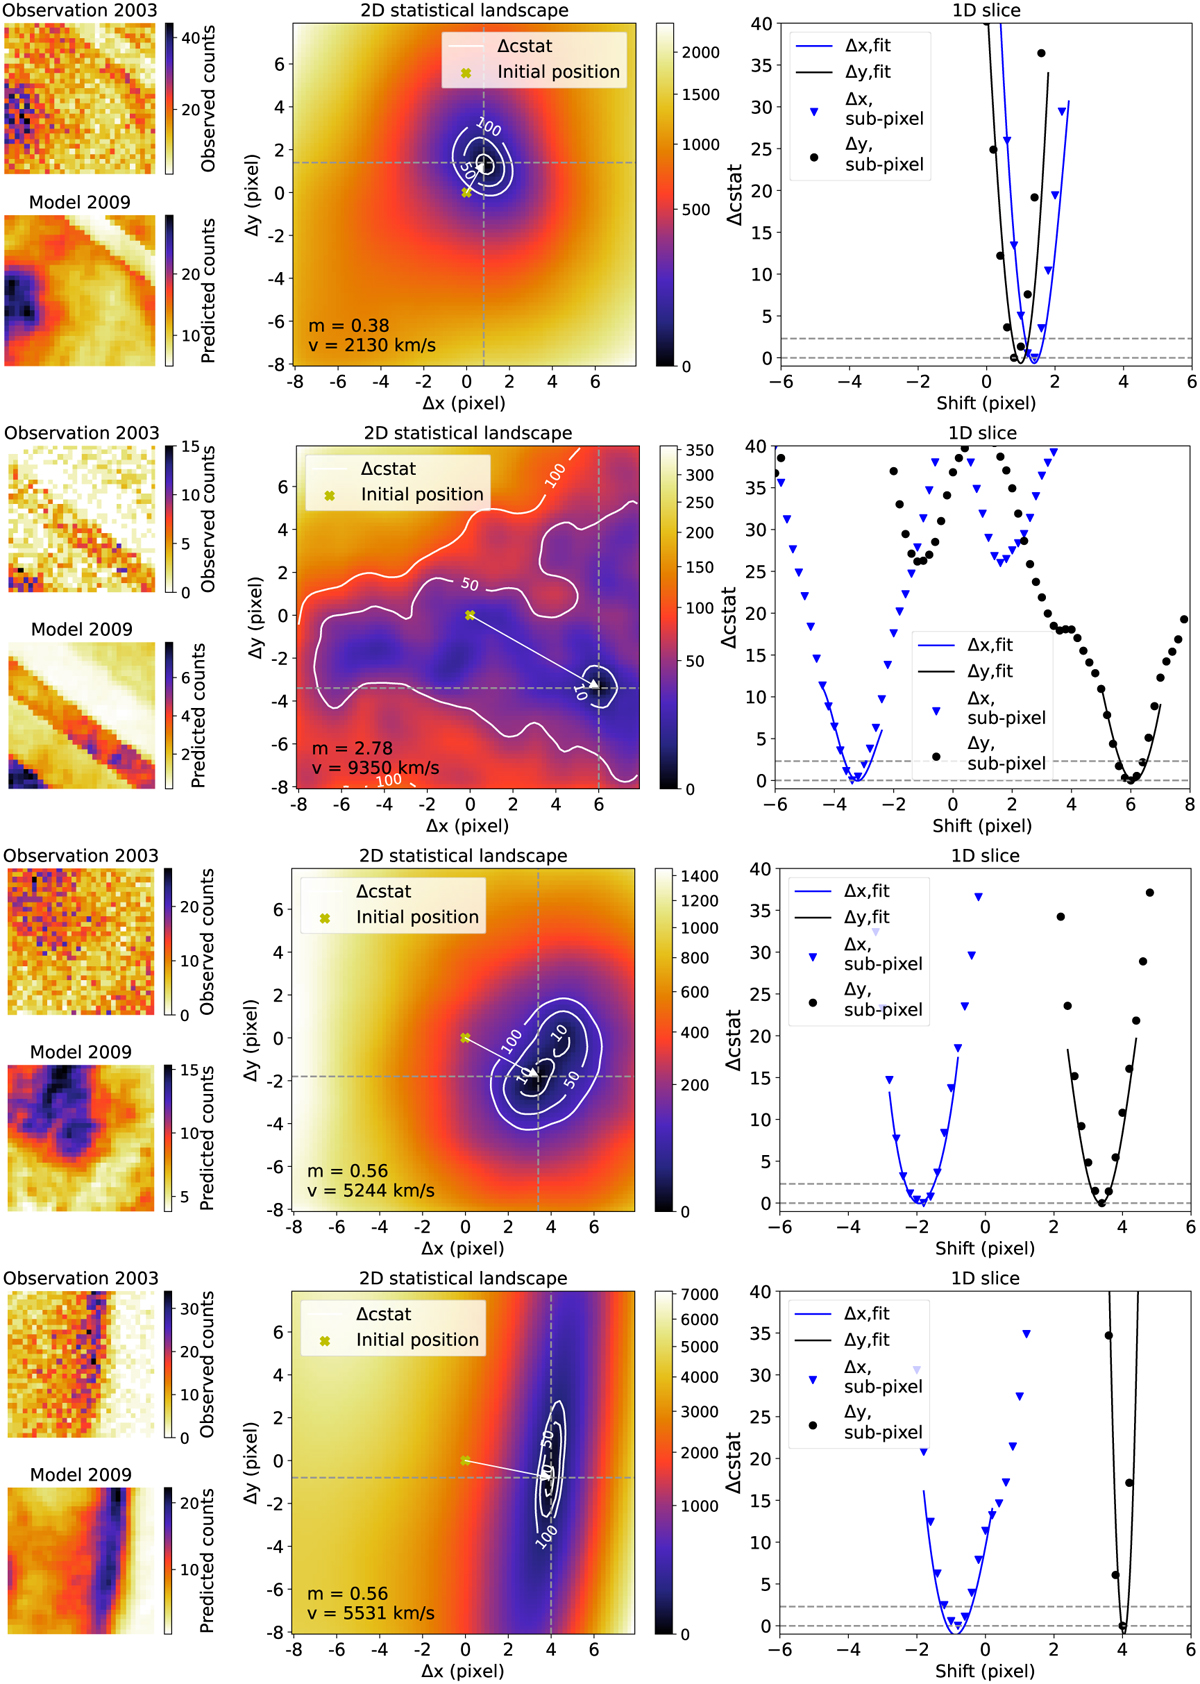
Fig. A.1
Download original image
Four detailed examples of our POF tool. Top left panel: Observation vignette (data of 2003). Bottom left panel: Model vignette (data of 2009) smoothed by 0″.4, corrected by the exposure map of the observation image (see Eq. 2) and without any shift. Central panel: Statistical landscape obtained when we shift the model vignette of (∆x, ∆y). The values have been subtracted from the minimum value of the landscape. The output vector, velocity, and expansion index are indicated. Right panel: Slices of this landscape (blue triangles along the x-axis and black dots along the y-axis) and the slices of the interpolating 2D polynomial. The horizontal lines correspond to the minimum of the landscape and the ∆cstat value to have 1 sigma uncertainties.
Current usage metrics show cumulative count of Article Views (full-text article views including HTML views, PDF and ePub downloads, according to the available data) and Abstracts Views on Vision4Press platform.
Data correspond to usage on the plateform after 2015. The current usage metrics is available 48-96 hours after online publication and is updated daily on week days.
Initial download of the metrics may take a while.