Fig. 10
Download original image
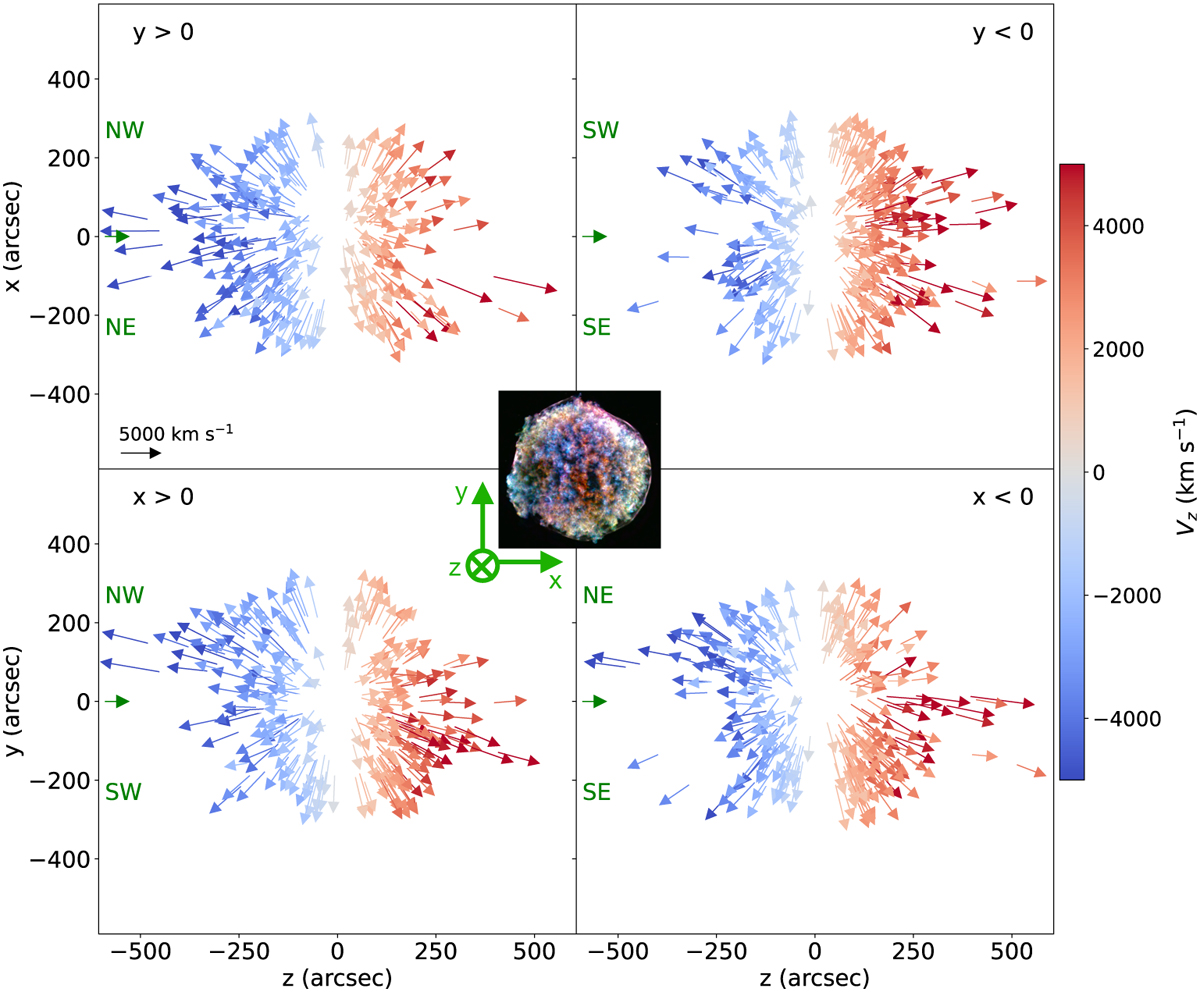
3D vector field of the dynamics of Tycho’s SNR based on our results. Top right and left: view along the y-axis (from above). Bottom right and left: view along the x-axis (from the right). The colors are the velocities Vz. The green arrows at left indicate the position of the observer and we added (in green) some indications of the zones seen by the observer looking at this plot. The lack of vectors for positions in the LoS z near zero, is due to a selection bias (see the text). A 3D visualisation is available online.
Current usage metrics show cumulative count of Article Views (full-text article views including HTML views, PDF and ePub downloads, according to the available data) and Abstracts Views on Vision4Press platform.
Data correspond to usage on the plateform after 2015. The current usage metrics is available 48-96 hours after online publication and is updated daily on week days.
Initial download of the metrics may take a while.