Fig. 1
Download original image
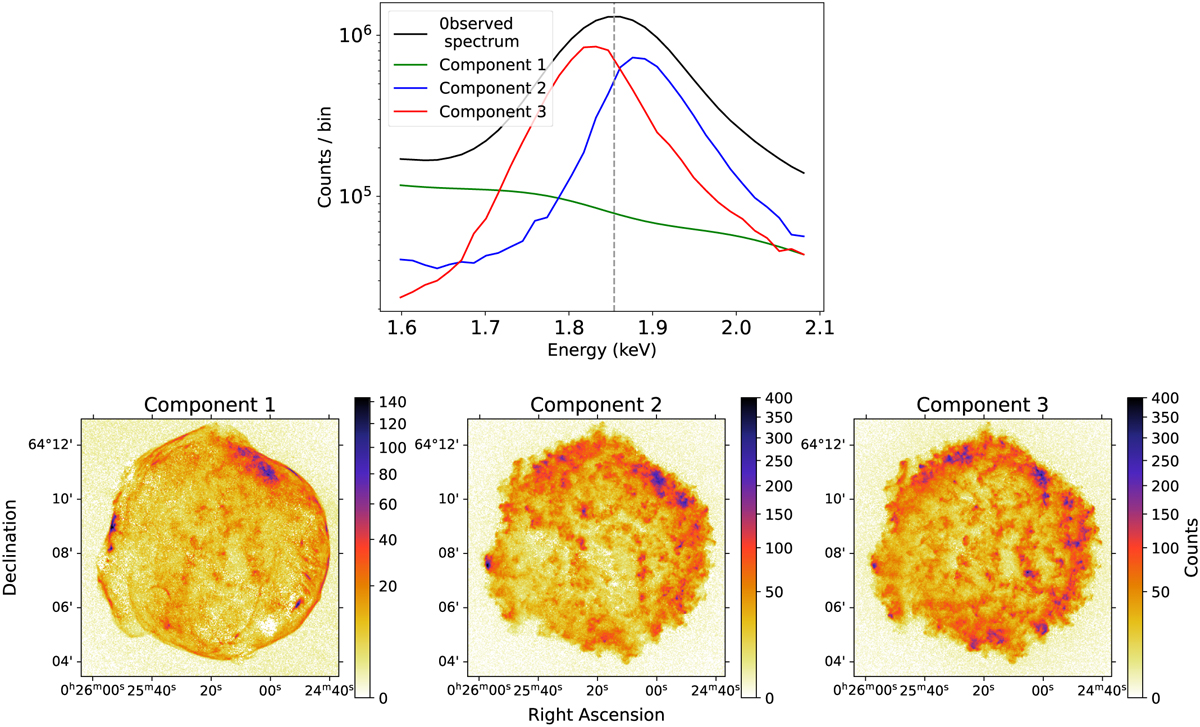
GMCA outputs for the data cube of Tycho’s SNR in the Si band (1.6–2.1 ke V). Top: observed spectrum for the all SNR (in black) compared to the three spectra found by GMCA. Bottom: images associated to the three spectral components found by GMCA. The exposure map was only corrected in the output images, not in the GMCA inputs. Based on the morphology and spectra of the outputs, we interpret the decomposition as follow: the first component corresponds to the continuum, mostly the synchrotron emission. The two others are the thermal emission of the ejecta, with component 2 being redshifted and component 3 being blueshifted.
Current usage metrics show cumulative count of Article Views (full-text article views including HTML views, PDF and ePub downloads, according to the available data) and Abstracts Views on Vision4Press platform.
Data correspond to usage on the plateform after 2015. The current usage metrics is available 48-96 hours after online publication and is updated daily on week days.
Initial download of the metrics may take a while.