Open Access
Fig. 1.
Download original image
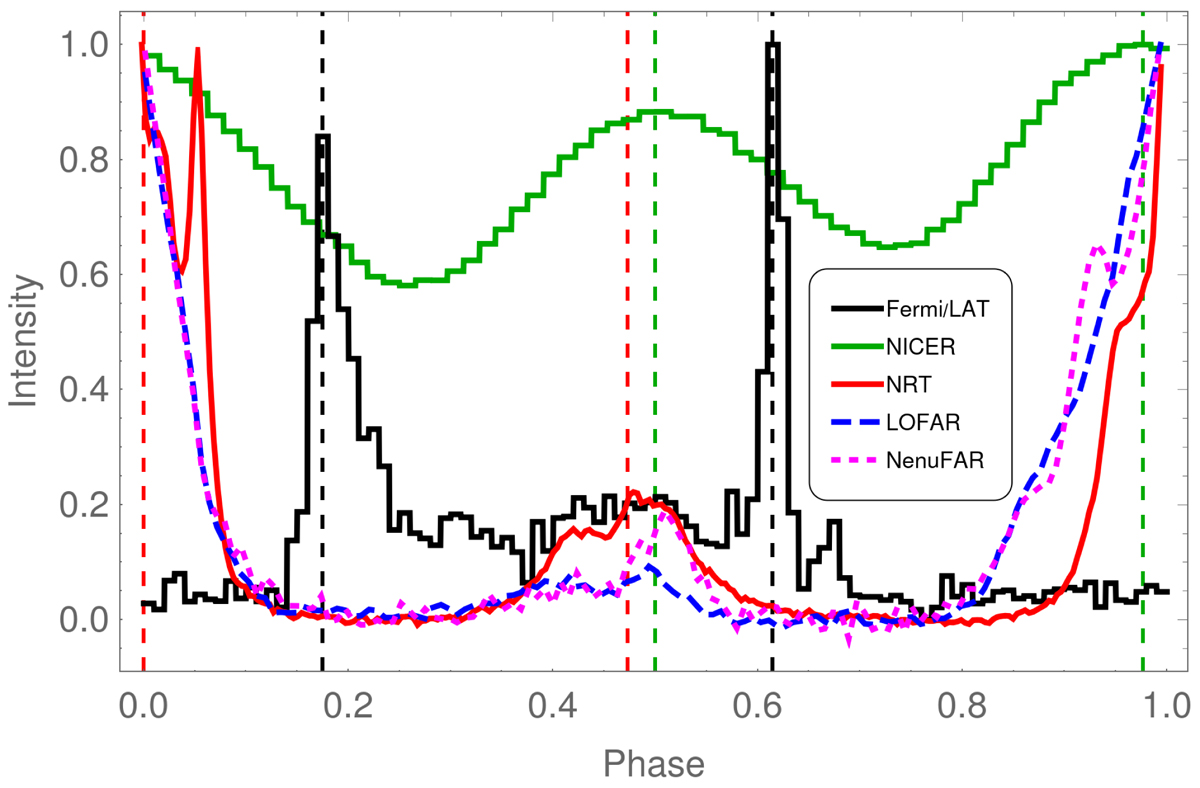
Time lags between peaks in the different wavelengths. Radio pulse profiles are in red for NRT, in dashed blue for LOFAR, and in dotted magenta for NenuFAR, while thermal X-ray profiles are in green, and Fermi/LAT profiles are in black. The dashed coloured vertical lines show the phase of the peak flux of each pulse.
Current usage metrics show cumulative count of Article Views (full-text article views including HTML views, PDF and ePub downloads, according to the available data) and Abstracts Views on Vision4Press platform.
Data correspond to usage on the plateform after 2015. The current usage metrics is available 48-96 hours after online publication and is updated daily on week days.
Initial download of the metrics may take a while.