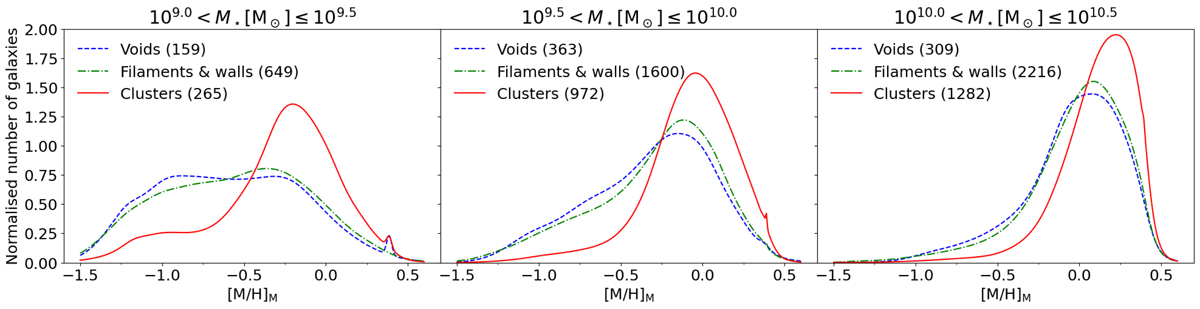
Fig. 2.
Download original image
Mass-weighted average stellar metallicity ([M/H]M) distribution of our samples of galaxies in voids (dashed blue line), filaments & walls (dot-dashed green line), and clusters (solid red line) for three stellar mass bins as labelled. The number of galaxies in each sample is shown in the legend. The peaks at ∼0.4 are due to the metallicity limit of the E-MILES stellar models. The distribution sharply ends at higher values (∼0.5) than the limit due to the widening by the errors.
Current usage metrics show cumulative count of Article Views (full-text article views including HTML views, PDF and ePub downloads, according to the available data) and Abstracts Views on Vision4Press platform.
Data correspond to usage on the plateform after 2015. The current usage metrics is available 48-96 hours after online publication and is updated daily on week days.
Initial download of the metrics may take a while.