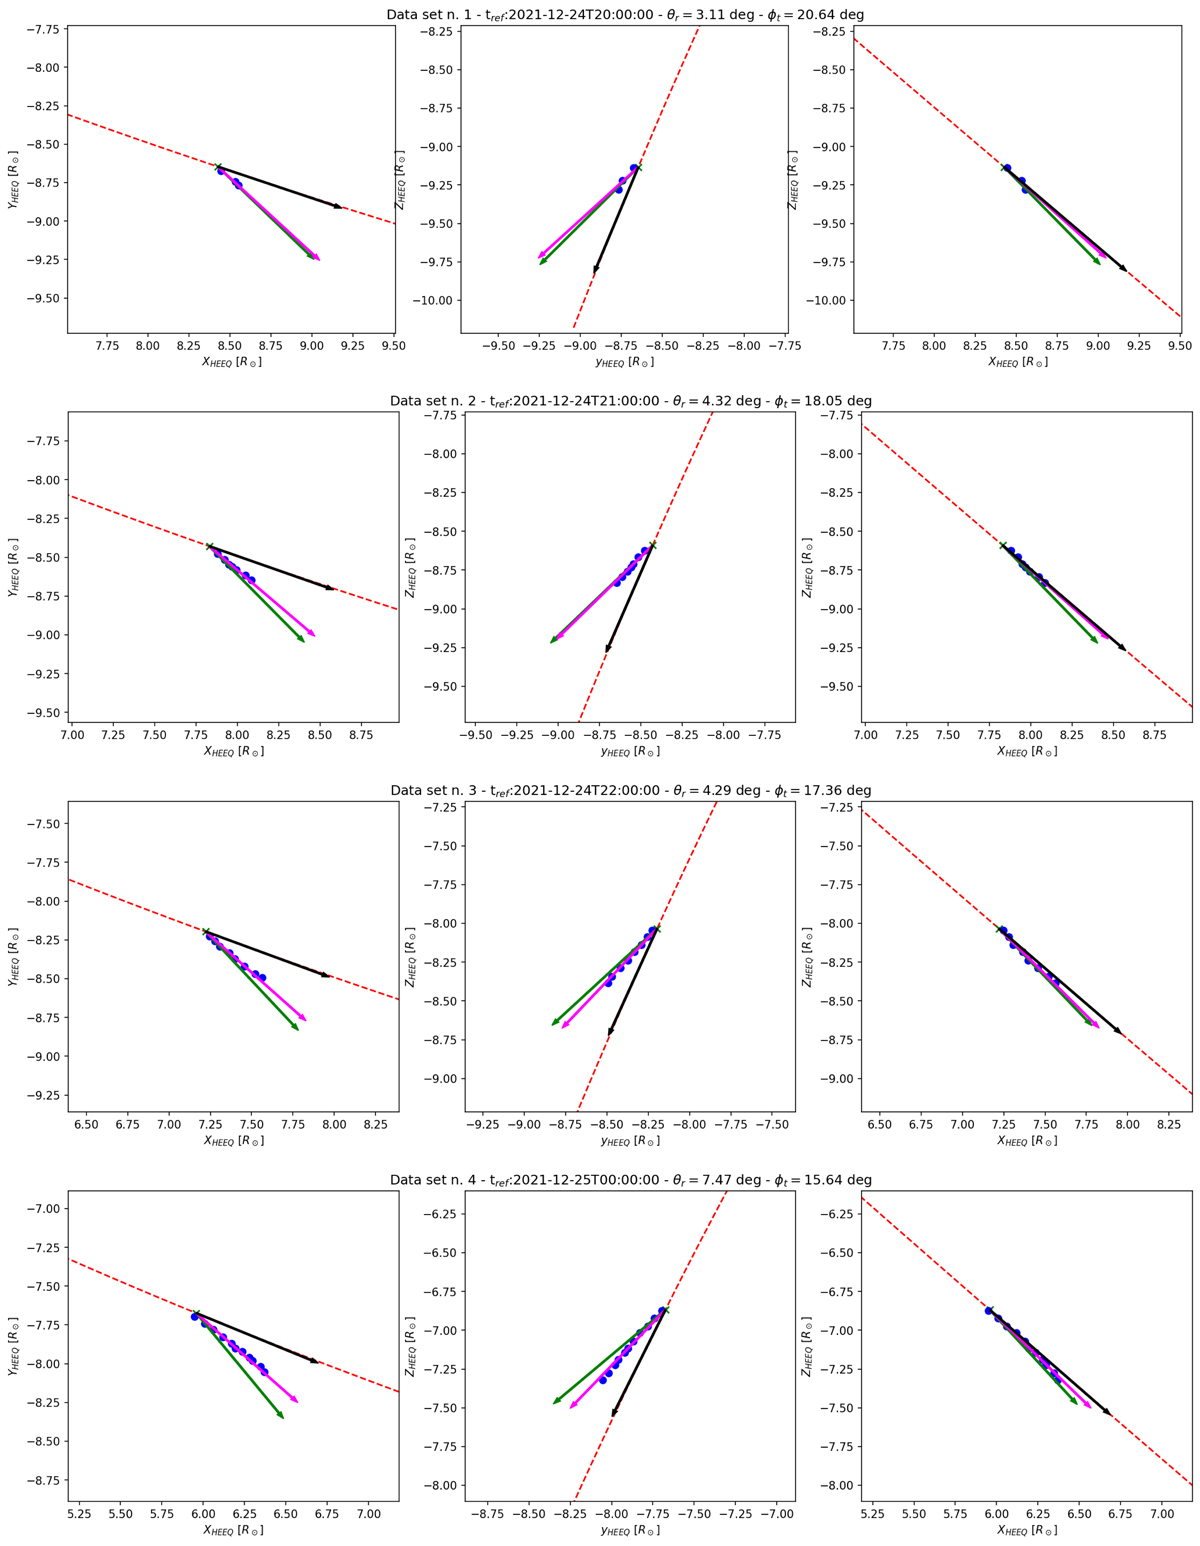
Fig. 6.
Download original image
Distribution of 3D tie points sampling the VL comet tail for the data sets listed in Table 3 (IDs 1-4). The three panels in each row show the projections of the tie points on the xy (left), yz (middle), and xz (right) planes of the HEEQ coordinate system. The points are plotted as blue dots. Shown relative to the position of the comet nucleus (green cross, as determined from the orbit) are the outward radial direction from the Sun (green arrow), the computed direction of the tail (magenta arrow), and the tangent to the comet trajectory (black arrow). The direction of the tail changes with respect to the radial and tangential direction along the comet orbit. The values of these angles are given above each sequence of panels.
Current usage metrics show cumulative count of Article Views (full-text article views including HTML views, PDF and ePub downloads, according to the available data) and Abstracts Views on Vision4Press platform.
Data correspond to usage on the plateform after 2015. The current usage metrics is available 48-96 hours after online publication and is updated daily on week days.
Initial download of the metrics may take a while.