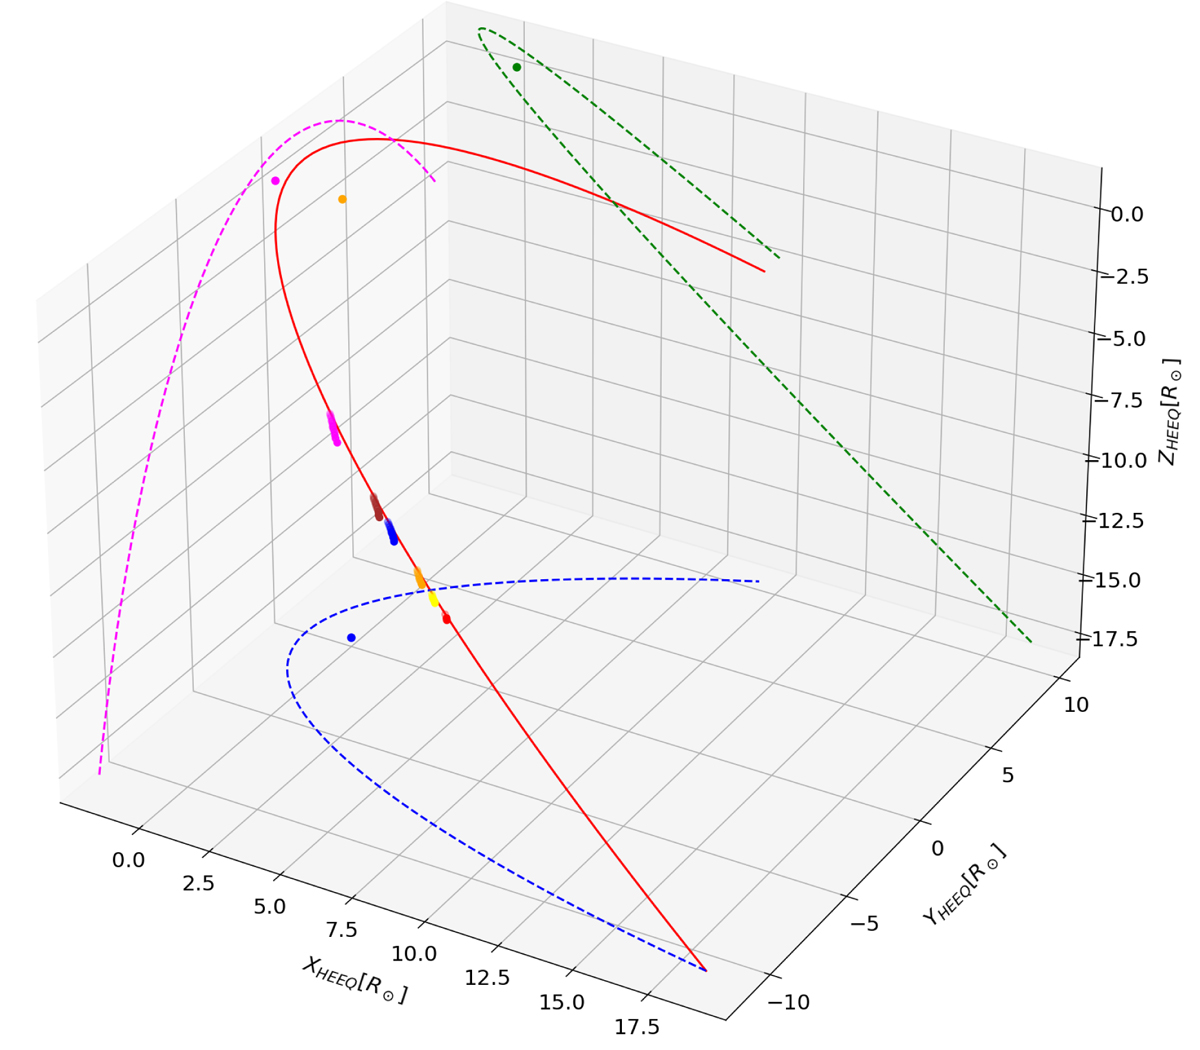
Fig. 5.
Download original image
Three-dimensional trajectory of the comet in the HEEQ reference frame (red line). The locations of the 3D points sampling the tail in the different sets of image pairs are shown as small colored dots. The different colors represent the different data sets at different times (see Table 3). The projections of the comet’s orbit onto the XY (blue), YZ (magenta), and XZ (green) planes are shown as dashed lines. The Sun’s position is shown as an orange dot, and its projections onto the different planes as colored dots.
Current usage metrics show cumulative count of Article Views (full-text article views including HTML views, PDF and ePub downloads, according to the available data) and Abstracts Views on Vision4Press platform.
Data correspond to usage on the plateform after 2015. The current usage metrics is available 48-96 hours after online publication and is updated daily on week days.
Initial download of the metrics may take a while.