Fig. 18.
Download original image
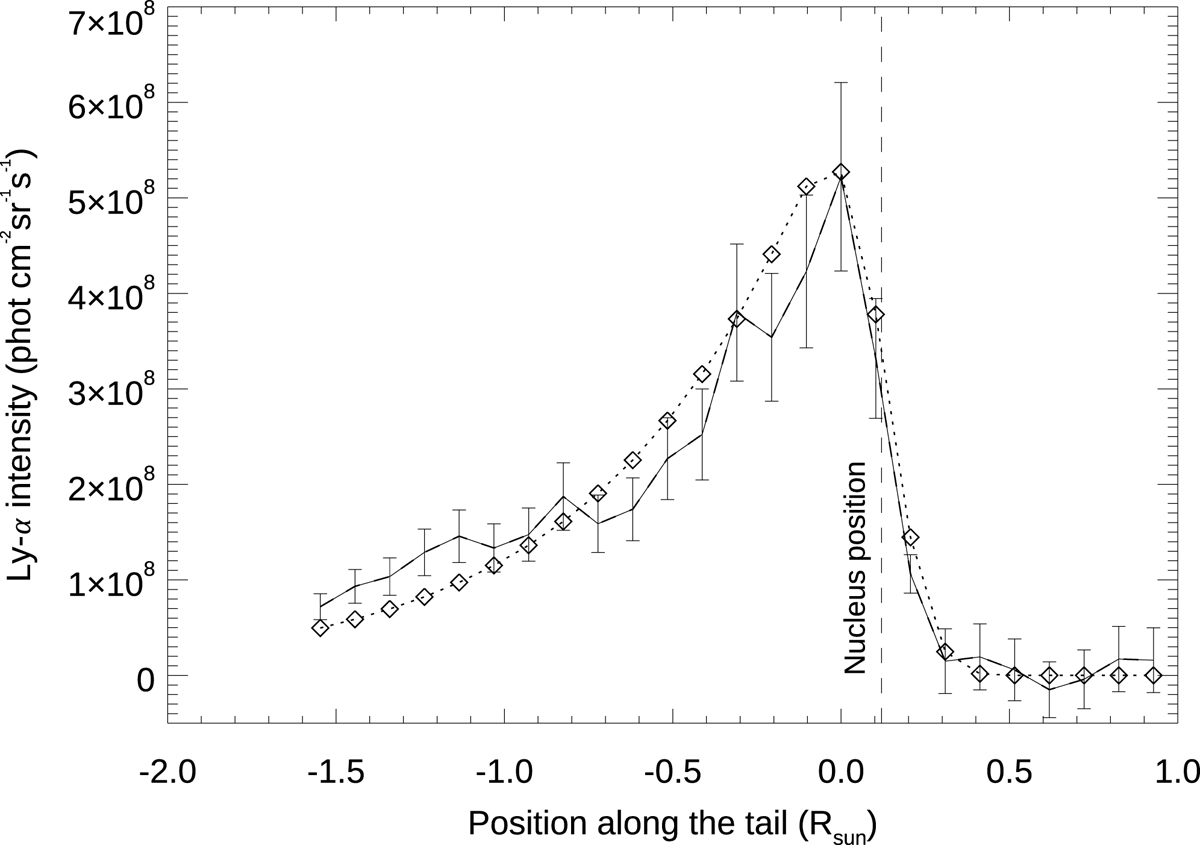
Lyman-α intensity distribution along the cometary tail, plotted as a function of distance from the location of the emission peak. Because of the comet’s relative speed with respect to the solar wind, the location of the comet nucleus is shifted by about 0.1 R⊙ with respect to the location of the Lyman-α emission peak.
Current usage metrics show cumulative count of Article Views (full-text article views including HTML views, PDF and ePub downloads, according to the available data) and Abstracts Views on Vision4Press platform.
Data correspond to usage on the plateform after 2015. The current usage metrics is available 48-96 hours after online publication and is updated daily on week days.
Initial download of the metrics may take a while.