Open Access
Fig. C.1
Download original image
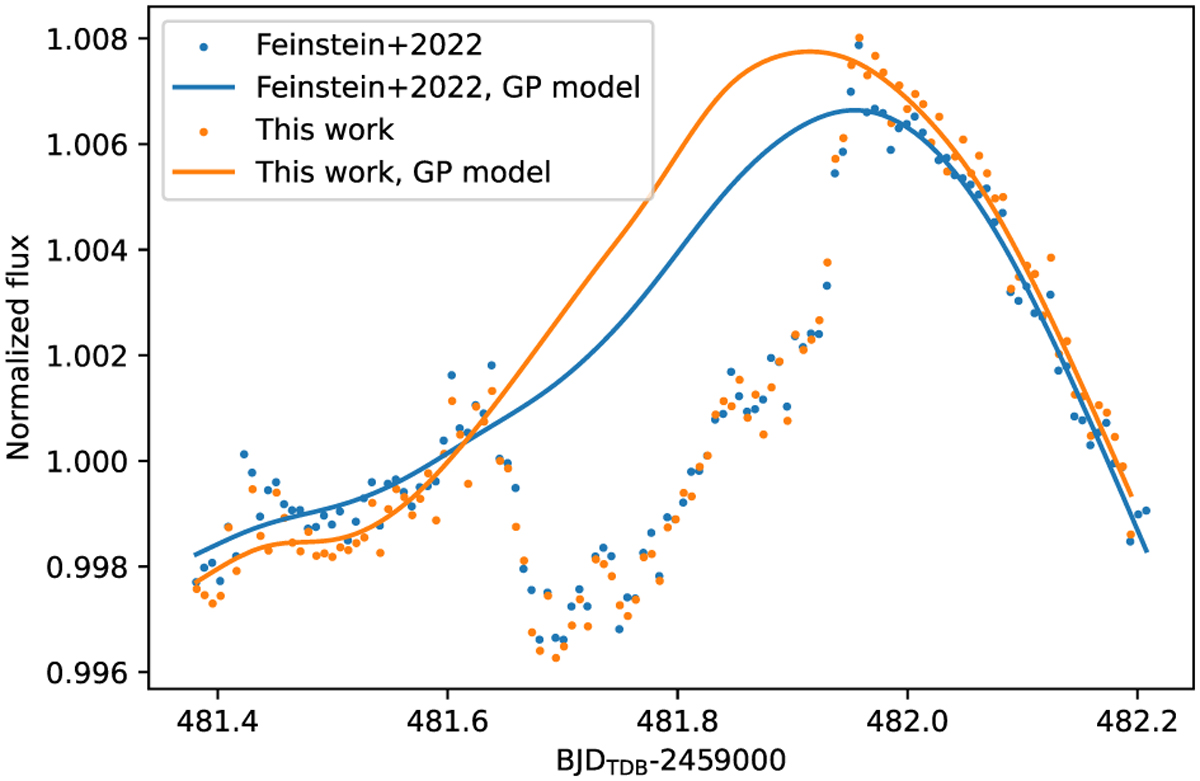
Comparison between our extracted TESS LC (orange dots) showing the transit attributed to V1298 Tau e, and the one extracted by Feinstein et al. (2022) (blue dots), including the corresponding best-fit GP models (solid curves).
Current usage metrics show cumulative count of Article Views (full-text article views including HTML views, PDF and ePub downloads, according to the available data) and Abstracts Views on Vision4Press platform.
Data correspond to usage on the plateform after 2015. The current usage metrics is available 48-96 hours after online publication and is updated daily on week days.
Initial download of the metrics may take a while.