Fig. B.1
Download original image
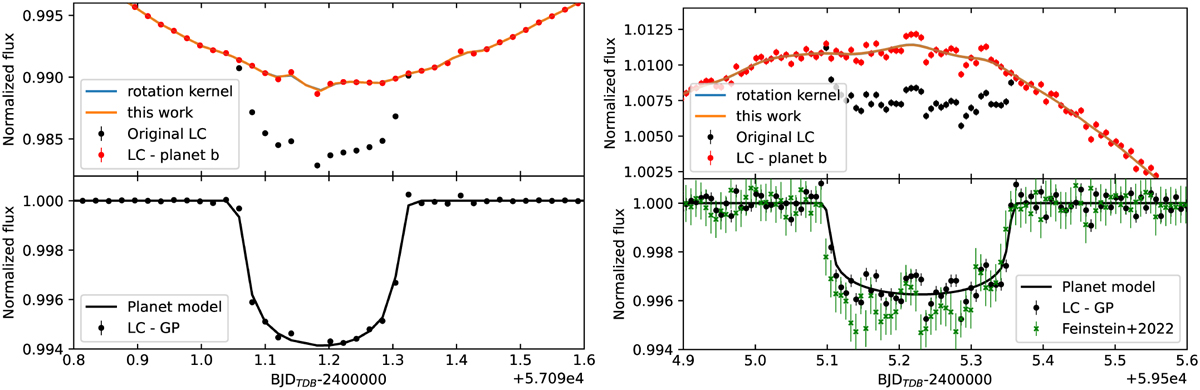
Portions of Kepler/K2 and TESS LCs showing a transit of planet V1298 Tau b (left and right panel respectively). The plots at the top show the undetrended LCs analysed in our work centred on the transit (black dots), and the data after removing the best-fit planetary transit (red dots) to show the GP signal during the transit timespan. The plots at the bottom show the transit signals after subtracting the best-fit GP model. The corresponding detrended and flattened TESS light curve analysed by Feinstein et al. (2022) is shown for comparison (green cross symbols). It has been obtained from the jupyter notebook made publicly available by Feinstein et al. (2022)10.
Current usage metrics show cumulative count of Article Views (full-text article views including HTML views, PDF and ePub downloads, according to the available data) and Abstracts Views on Vision4Press platform.
Data correspond to usage on the plateform after 2015. The current usage metrics is available 48-96 hours after online publication and is updated daily on week days.
Initial download of the metrics may take a while.