Fig. A.1
Download original image
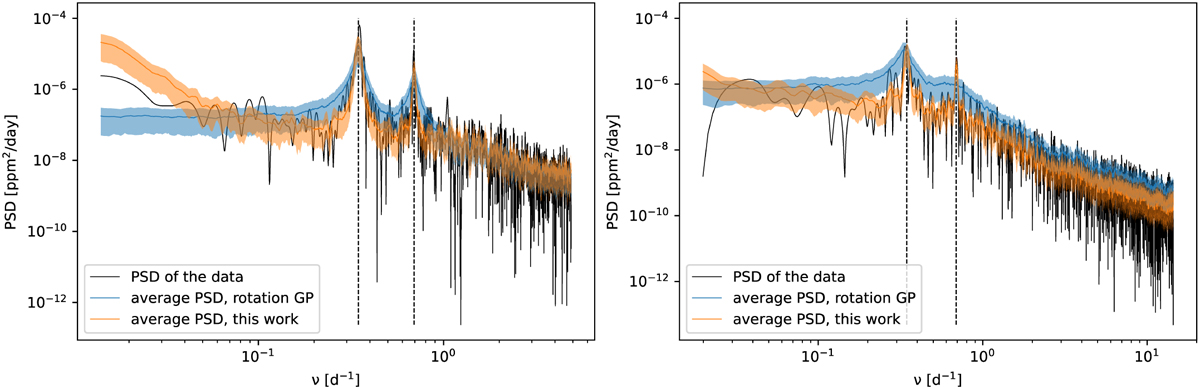
Analysis of the PSD of the Kepler/K2 (left) and TESS (right) LCs. In each panel, the black solid line shows the PSD of the LC after masking the planetary transits. The two vertical dashed lines mark the frequencies 0.35 d−1 and 0.70 d−1. The confidence band in orange shows the average periodogram obtained using the rotation GP, as discussed in the text. Similarly, the blue confidence band corresponds to the GP model used in this work.
Current usage metrics show cumulative count of Article Views (full-text article views including HTML views, PDF and ePub downloads, according to the available data) and Abstracts Views on Vision4Press platform.
Data correspond to usage on the plateform after 2015. The current usage metrics is available 48-96 hours after online publication and is updated daily on week days.
Initial download of the metrics may take a while.