Open Access
Fig. C.2
Download original image
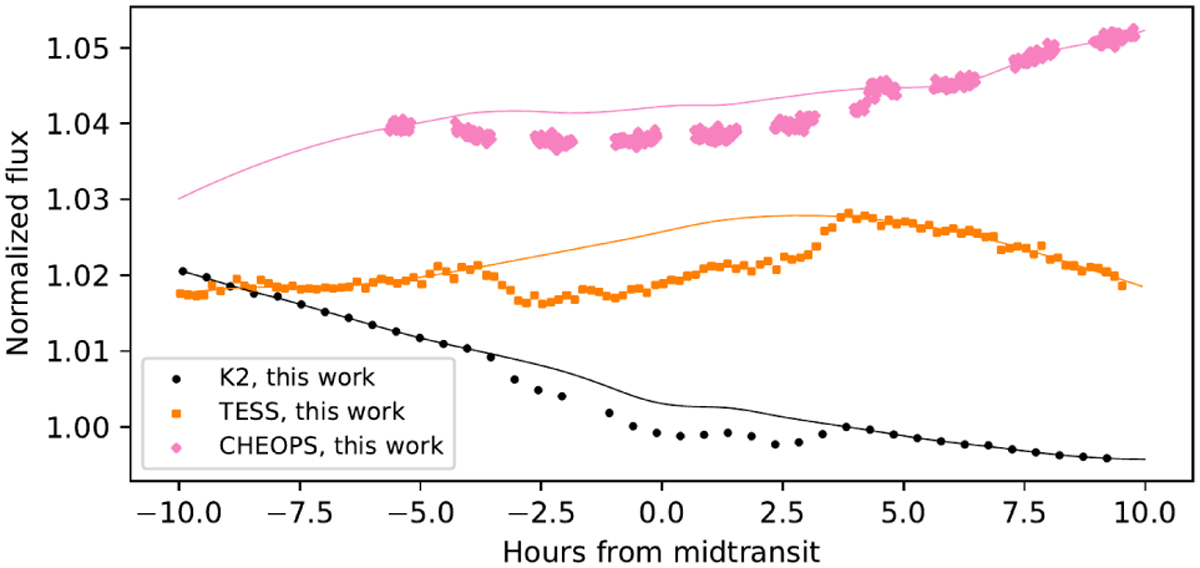
Undetrended LCs of the three transits analysed in our work and shown in Fig. 4 (Kepler/K2, TESS, and CHEOPS), with our calculated best-fit GP models overplotted. An offset has been added to each curve in order to improve the clarity of the plot.
Current usage metrics show cumulative count of Article Views (full-text article views including HTML views, PDF and ePub downloads, according to the available data) and Abstracts Views on Vision4Press platform.
Data correspond to usage on the plateform after 2015. The current usage metrics is available 48-96 hours after online publication and is updated daily on week days.
Initial download of the metrics may take a while.