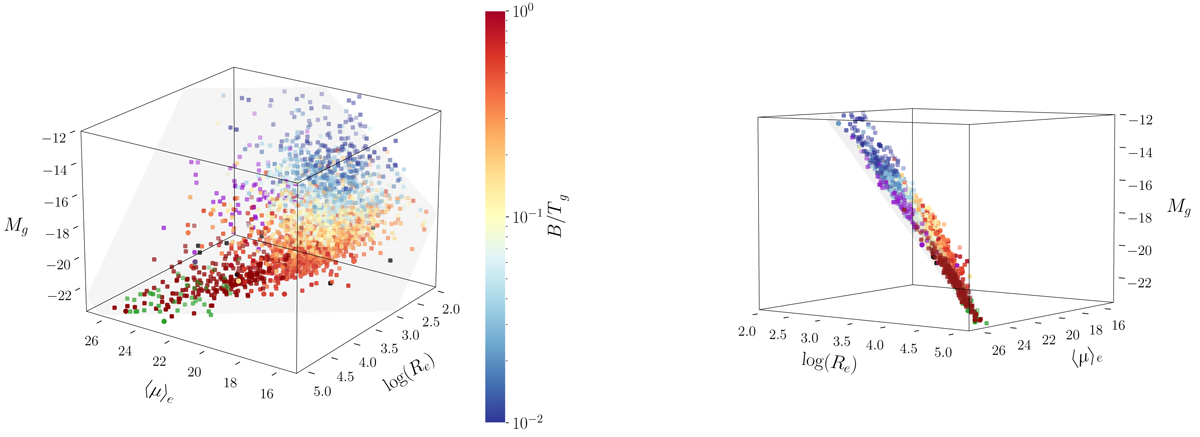
Fig. 9.
Download original image
Distribution in the ⟨μ⟩e, Re, Mg tridimensional space of E (dark red), cD (purple), dE (green), cE (black) galaxies using their single-Sérsic fits, and of the bulges of all lenticular and spiral types from bulge and disk decompositions color-coded by B/Tg, the bulge-to-total luminosity ratio in the g band. Two different views are shown on the left and right, in order to highlight the fact that galaxies are distributed along a plane, as predicted from Eq. (12), with a small dispersion around it due to redshift: the gray plane is drawn for z = 0 and is best seen in the left panel. The Kormendy and size–luminosity relations are projections against the corresponding faces of the cube.
Current usage metrics show cumulative count of Article Views (full-text article views including HTML views, PDF and ePub downloads, according to the available data) and Abstracts Views on Vision4Press platform.
Data correspond to usage on the plateform after 2015. The current usage metrics is available 48-96 hours after online publication and is updated daily on week days.
Initial download of the metrics may take a while.