Fig. 8.
Download original image
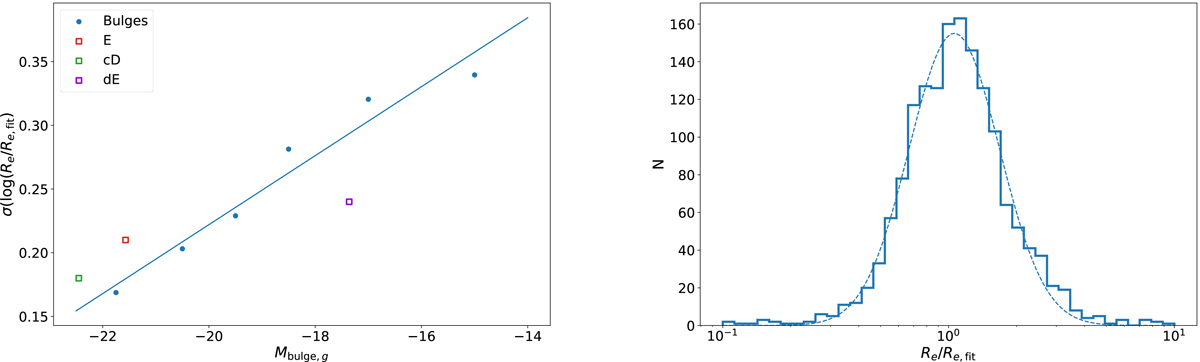
Dispersion around the size–luminosity relations for the EFIGI Sérsic and bulge components from Fig. 7. Left: variation of the rms dispersion in the logarithm of the ratio between the actual bulge effective radius Re and the fitted value Re, fit as a function of bulge magnitude Mbulge, g around the size–luminosity relation (Eq. (19)) for the Sérsic components and bulges of all types of EFIGI galaxies plotted in the right panel of Fig. 7. The estimated rms dispersion in Re/Re, fit increases for fainter bulges, and can be approximated by a linear regression. For comparison, the dispersion around the second-degree fit for the single-Sérsic profile of E galaxies (Eq. (15)), and the linear fits to cD and dE galaxies (Eqs. (17) and (18)) at the mean magnitude of galaxies of each type are shown with different symbols and colors. Right: histogram of Re/Re, fit for the Sérsic components and bulges of all types of EFIGI galaxies. In order to account for the increasing dispersion around the fit seen in the left panel, the values of log(Re/Re, fit) are divided by the dispersion in the magnitude bin in which they lie, then renormalized to the average over the values for all magnitude intervals.
Current usage metrics show cumulative count of Article Views (full-text article views including HTML views, PDF and ePub downloads, according to the available data) and Abstracts Views on Vision4Press platform.
Data correspond to usage on the plateform after 2015. The current usage metrics is available 48-96 hours after online publication and is updated daily on week days.
Initial download of the metrics may take a while.