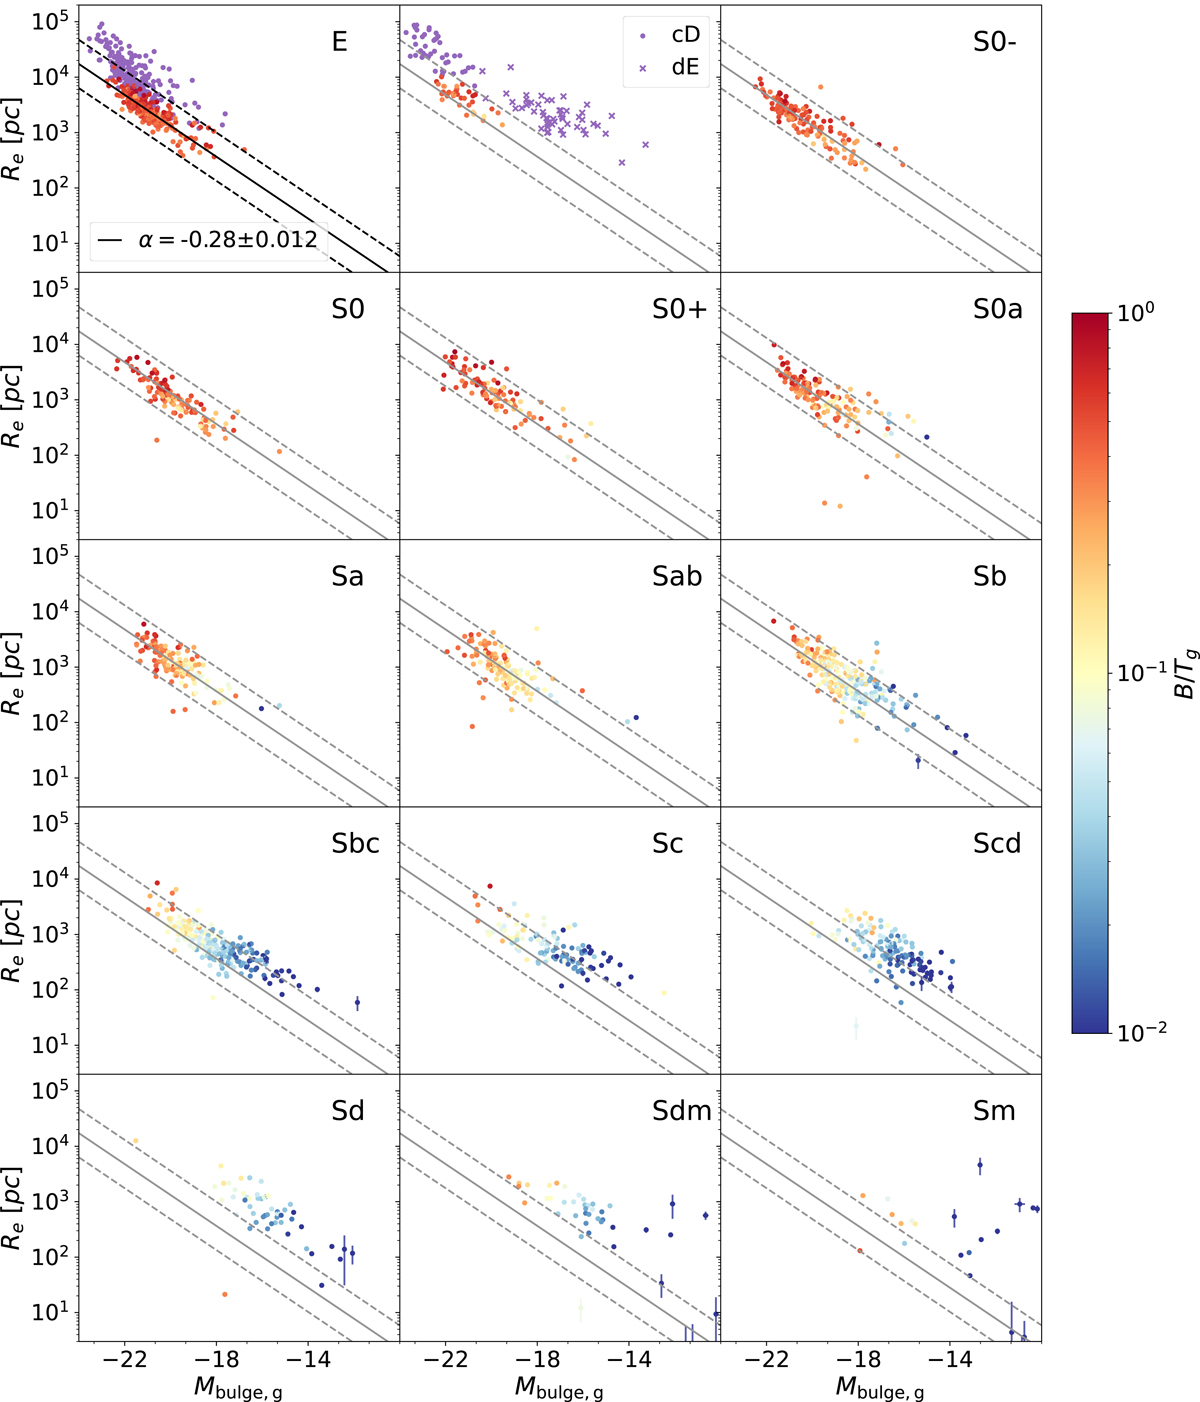
Fig. 6.
Download original image
Size–luminosity relation for the Sérsic components of EFIGI E and cD galaxies, and for the bulges of lenticular and spiral types with Inclination ≤ 2, all in the g band. The purple points in the 2 upper left panels represent the same relation for the E, cD and dE galaxies modeled as a single Sérsic profile. The solid line in the upper-left panel shows the linear fit of log(Re) as a function of Mg for all EFIGI E Sérsic components, and the dashed lines are offset by ±3 times the rms dispersion in log(Re) around the fit. These solid and dashed lines are repeated in gray in all other panels. The color of the points represents the bulge-to-total luminosity ratio in the g band, B/Tg. Both effective radii and luminosities of bulges get smaller while spanning the Hubble sequence.
Current usage metrics show cumulative count of Article Views (full-text article views including HTML views, PDF and ePub downloads, according to the available data) and Abstracts Views on Vision4Press platform.
Data correspond to usage on the plateform after 2015. The current usage metrics is available 48-96 hours after online publication and is updated daily on week days.
Initial download of the metrics may take a while.