Fig. 4.
Download original image
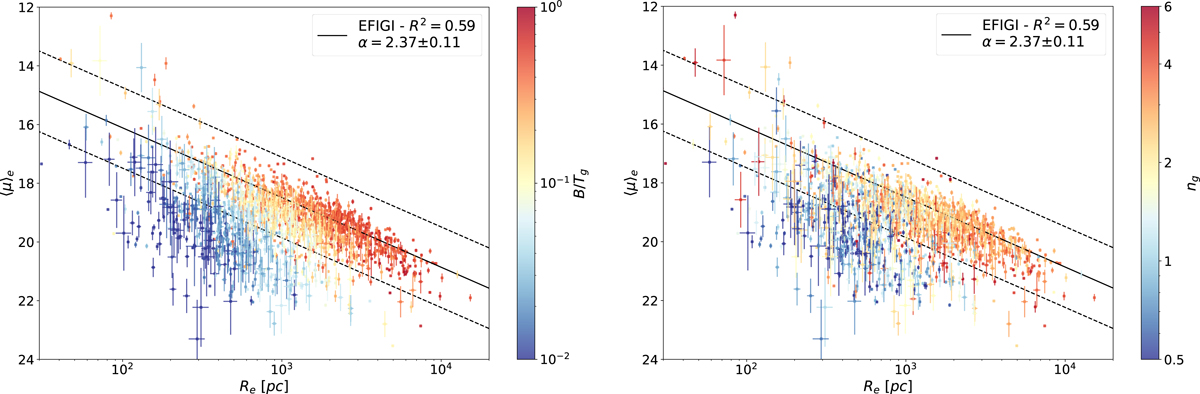
Mean effective surface brightness ⟨μ⟩e versus effective radius Re for the Sérsic components of E types and the bulges of all Hubble types from S0− to Sm with Inclination ≤ 2, all in the g band (dE types are excluded from this graph). The panels are color-coded by the bulge-to-total ratio B/Tg (left) and the Sérsic index ng (right) respectively. The black solid line in both panels is the linear fit for EFIGI E Sérsic components, while the dashed lines have the same slope and are offset by ±3 times the rms dispersion in ⟨μ⟩e around that fit. The departure from the Kormendy relation occurs as both B/Tg and ng decrease to the lowest possible values, while the highest ones are found for the highest radii along the Kormendy relation.
Current usage metrics show cumulative count of Article Views (full-text article views including HTML views, PDF and ePub downloads, according to the available data) and Abstracts Views on Vision4Press platform.
Data correspond to usage on the plateform after 2015. The current usage metrics is available 48-96 hours after online publication and is updated daily on week days.
Initial download of the metrics may take a while.