Fig. 3.
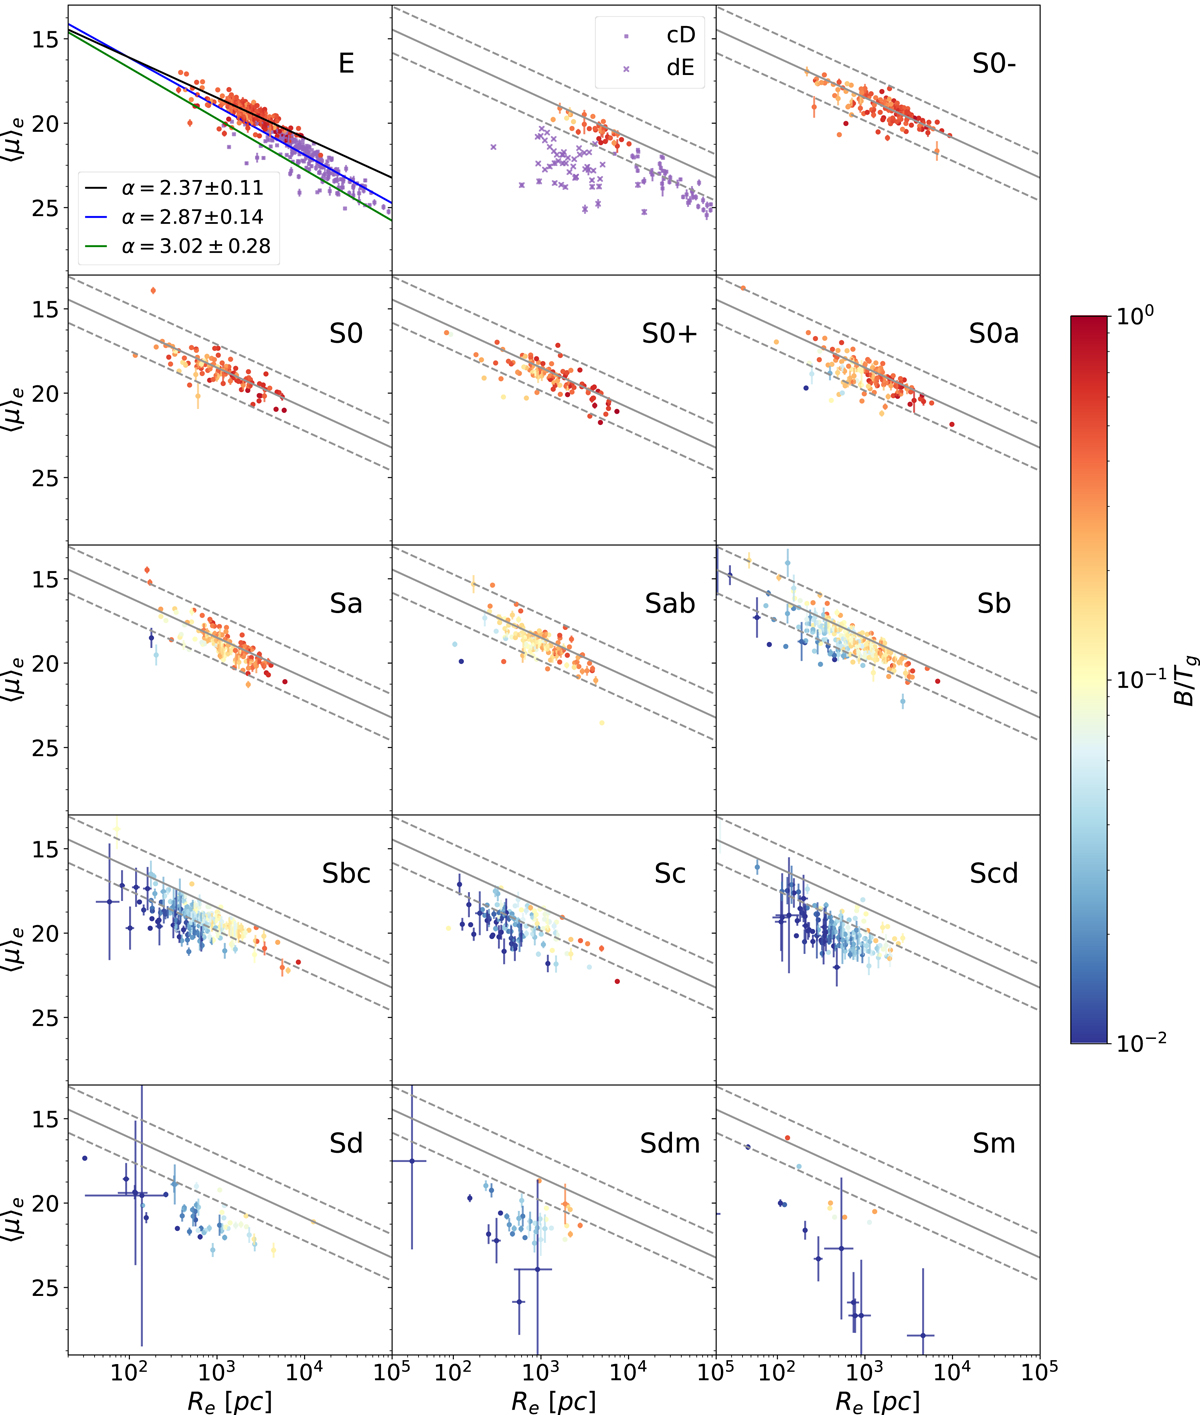
Download original image
Mean effective surface brightness ⟨μ⟩e versus effective radius Re for the Sérsic components of EFIGI E and cD galaxies, and for the bulges of lenticular and spiral types with Inclination ≤ 2, all derived from the Sérsic bulge and exponential disk decompositions, in the g band. The purple points in the 2 upper left panels represent the same relation for the E, cD and dE galaxies modeled as a single Sérsic profile. In the upper-left panel are shown the linear fits of ⟨μ⟩e as a function of Re for the Sérsic components and single-Sérsic fits to elliptical galaxies in black and blue respectively, as well as the Kormendy (1977) relation, in green. The fit to the E Sérsic component (in black) is repeated in solid gray in the other panels, with the dashed lines showing the same line offset by ±3 times the rms dispersion in ⟨μ⟩e around the fit for the E types. The color of the points represent the bulge-to-total luminosity ratio in the g band B/Tg. Almost all bulges of types S0− to Sb are within 3σ of the linear fit to the E Sérsic components. Later types progressively shift to smaller effective radii and lower values of B/Tg, as well as dimmer effective surface brigthnesses than what would be expected from the Kormendy relation at these radii.
Current usage metrics show cumulative count of Article Views (full-text article views including HTML views, PDF and ePub downloads, according to the available data) and Abstracts Views on Vision4Press platform.
Data correspond to usage on the plateform after 2015. The current usage metrics is available 48-96 hours after online publication and is updated daily on week days.
Initial download of the metrics may take a while.