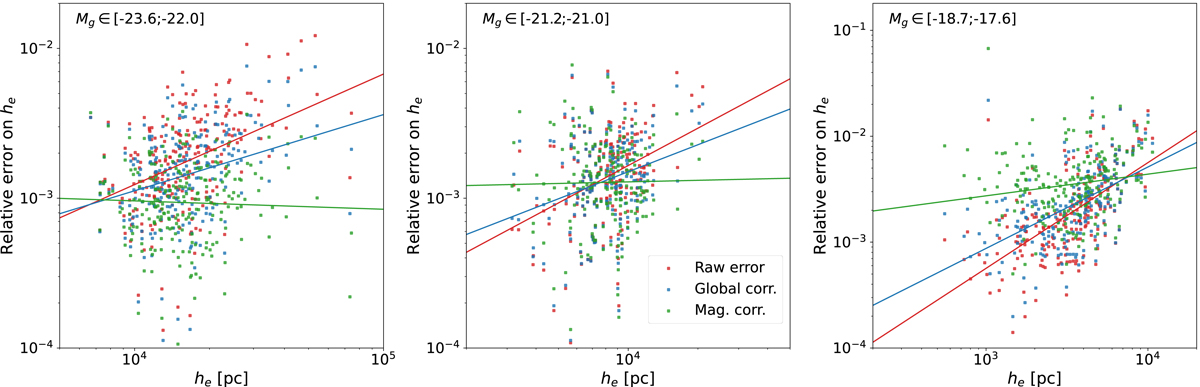
Fig. 2.
Download original image
Distribution of the relative error on the physical disk effective radii σ(he)/he as a function of he in bins of total galaxy absolute magnitude in the g band. Only 3 bins are shown as examples of the general behavior. The color of the points represent the type of plotted error (see text for details) and the lines are the corresponding linear regression. There is a trend of relative errors increasing with he for the raw errors (in red). The correction derived globally over all absolute magnitudes (in blue) reduces the bias, whereas the correction by minimization over 12 mag intervals (in green), actually erases it.
Current usage metrics show cumulative count of Article Views (full-text article views including HTML views, PDF and ePub downloads, according to the available data) and Abstracts Views on Vision4Press platform.
Data correspond to usage on the plateform after 2015. The current usage metrics is available 48-96 hours after online publication and is updated daily on week days.
Initial download of the metrics may take a while.