Fig. 12.
Download original image
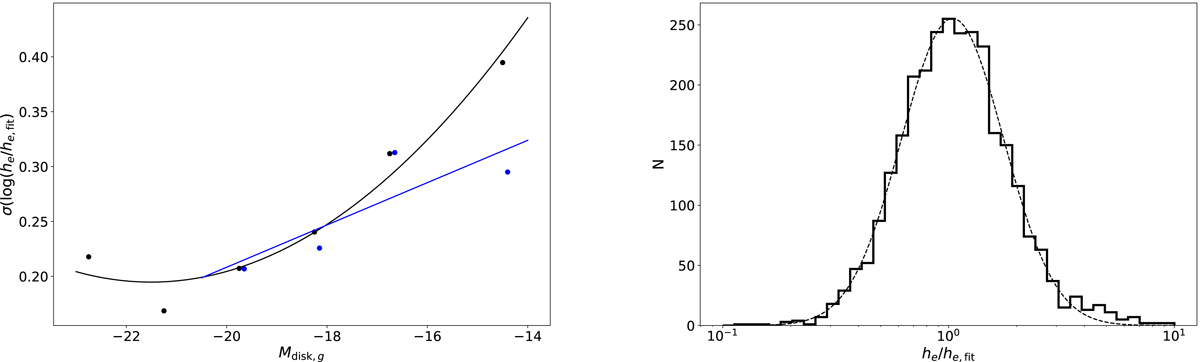
Dispersion around the size–luminosity relations for the EFIGI exponential and disk components from Fig. 11. Left: variation of the rms dispersion in the logarithm of the ratio between the actual disk effective radius he and the fitted value he, fit as a function of disk magnitude Mdisk, g around the size–luminosity relations plotted in Fig. 11 for EFIGI galaxies, as a function of the mean disk magnitude in 1.5 or 3 mag intervals. The dispersion around the second degree fit is shown as black points, and that around the linear fit to Sd-Im types only as blue points (and calculated only for Mdisk, g > −20.5). The resulting dispersion values are fitted with a second degree polynomial (black), and a linear regression (blue) respectively. In both cases, the estimated dispersion increases for fainter disks. Right: histogram of he/he, fit for the size–luminosity relation for all disks of EFIGI lenticulars and spirals as well as irregulars. In order to account for the increasing dispersion around the fit seen in the left panel, the values of log(he/he, fit) are divided by the dispersion in the magnitude bin in which they lie, then renormalized to the average over the values for all magnitude intervals.
Current usage metrics show cumulative count of Article Views (full-text article views including HTML views, PDF and ePub downloads, according to the available data) and Abstracts Views on Vision4Press platform.
Data correspond to usage on the plateform after 2015. The current usage metrics is available 48-96 hours after online publication and is updated daily on week days.
Initial download of the metrics may take a while.