Fig. 6.
Download original image
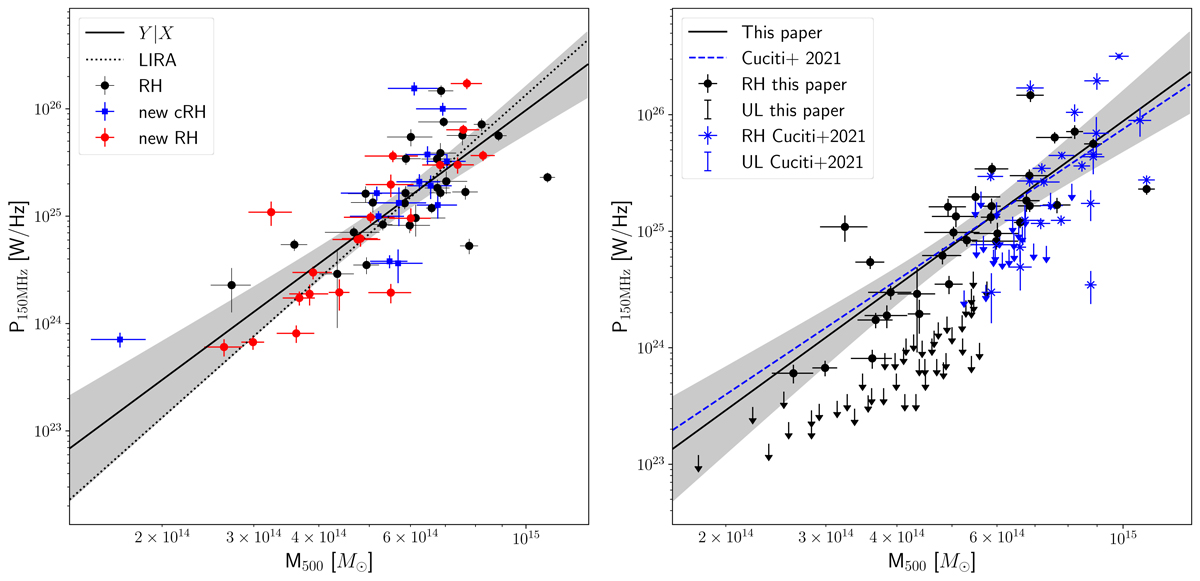
Comparison with previous studies. Left: black points represent radio halo clusters from the literature, red points are newly discovered radio halos, and blue squares are new candidate radio halos. Right: comparison with Cuciti et al. (2021a) rescaled at 150 MHz assuming α = −1.3. Black points and arrows are radio halos and upper limits from the LOFAR sample, and blue stars and arrows are radio halos and upper limits in Cuciti et al. (2021a). The black solid line is the same as in Fig. 2 (right). The dashed blue line is the correlation obtained for the Cuciti et al. (2021a) sample including radio halos and USSRH.
Current usage metrics show cumulative count of Article Views (full-text article views including HTML views, PDF and ePub downloads, according to the available data) and Abstracts Views on Vision4Press platform.
Data correspond to usage on the plateform after 2015. The current usage metrics is available 48-96 hours after online publication and is updated daily on week days.
Initial download of the metrics may take a while.