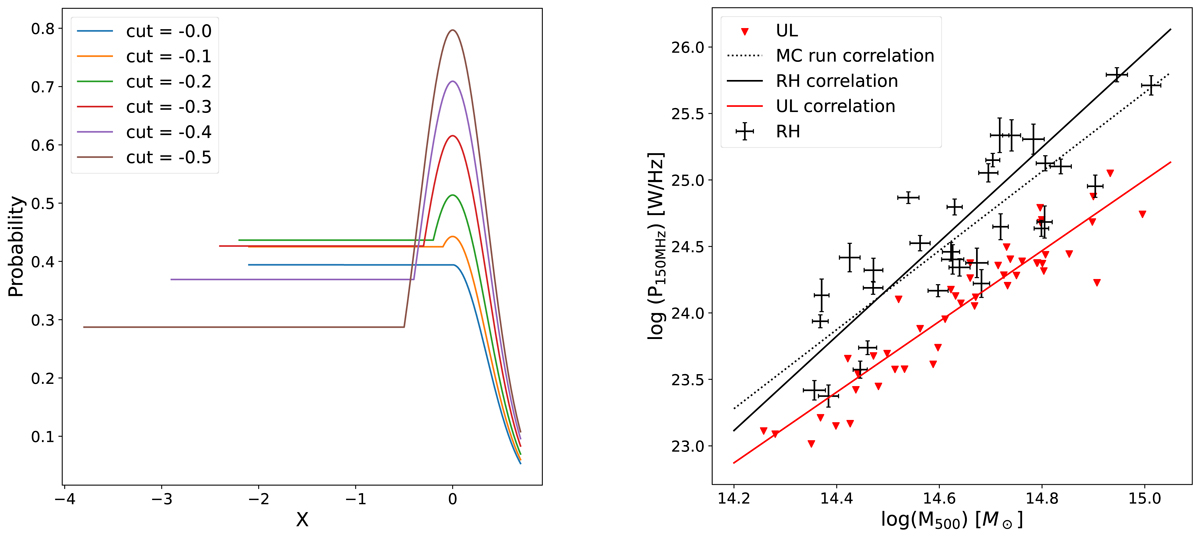
Fig. 5.
Download original image
Monte Carlo test. Left: PDFs with different cuts. PDFs are normalised so that the area below each curve corresponds to 1. We used these PDFs to randomly extract values to add to the radio power of halos on the correlation and distributed them on the M–P plane. Right: example random distribution of clusters in the mass–radio power diagram. Errorbars are radio halos, arrows are upper limits. The black and red solid lines represent the radio halo and upper limits correlation we find in the sample, respectively.
Current usage metrics show cumulative count of Article Views (full-text article views including HTML views, PDF and ePub downloads, according to the available data) and Abstracts Views on Vision4Press platform.
Data correspond to usage on the plateform after 2015. The current usage metrics is available 48-96 hours after online publication and is updated daily on week days.
Initial download of the metrics may take a while.