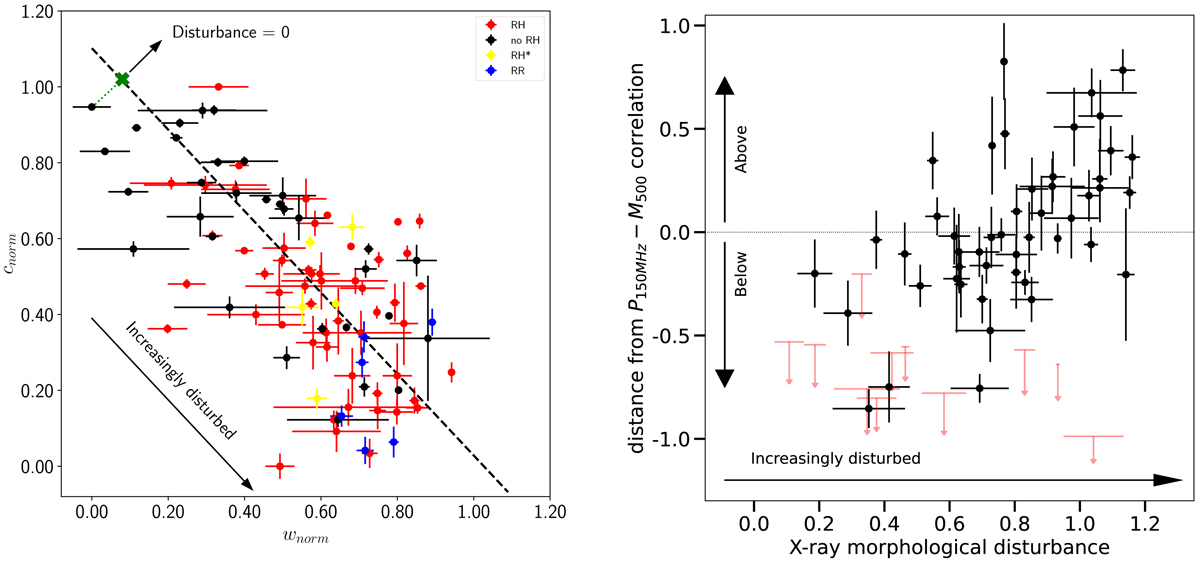
Fig. 3.
Download original image
X-ray morphological disturbance. Left: normalised concentration parameter–centroid shift diagram for all the clusters of the sample with available X-ray observations. The black dashed line is the regression line. The green cross marks the projection on the regression line of the cluster with disturbance = 0. Right: distance of radio halos (black points) and upper limits (red arrows) from the mass–radio power correlation (BCES Y|X method) versus X-ray morphological disturbance.
Current usage metrics show cumulative count of Article Views (full-text article views including HTML views, PDF and ePub downloads, according to the available data) and Abstracts Views on Vision4Press platform.
Data correspond to usage on the plateform after 2015. The current usage metrics is available 48-96 hours after online publication and is updated daily on week days.
Initial download of the metrics may take a while.