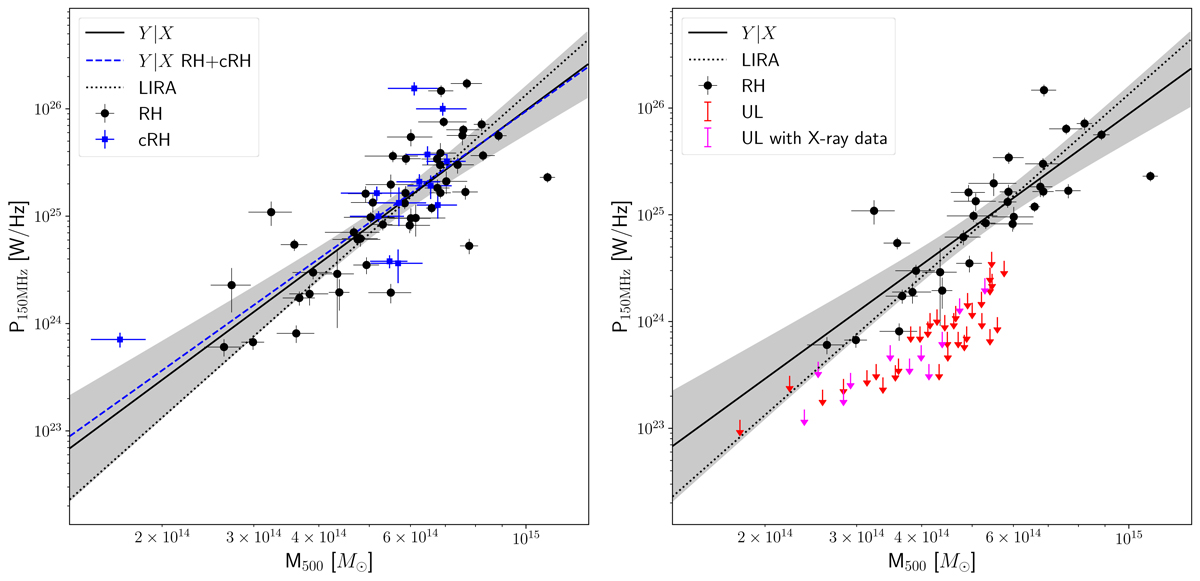
Fig. 2.
Download original image
Mass–radio power diagram. Left: mass–radio power diagram for radio halos (black points) and candidate radio halos (blue squares) above the 50% Planck completeness. The solid line and the shadowed region represent the correlation to radio halos only obtained with the BCES Y|X method and the 95% confidence region. The dashed line is the correlation obtained considering also candidate radio halos. The black dotted line is obtained fitting only radio halos with LIRA. Right: mass–radio power diagram for clusters with radio halos and upper limits with 0.06 < z < 0.4 and 100 kpc < re < 400 kpc. The solid line and the shadowed region represent the correlation obtained with the BCES Y|X method and the 95% confidence region, while the dotted black line is obtained with LIRA.
Current usage metrics show cumulative count of Article Views (full-text article views including HTML views, PDF and ePub downloads, according to the available data) and Abstracts Views on Vision4Press platform.
Data correspond to usage on the plateform after 2015. The current usage metrics is available 48-96 hours after online publication and is updated daily on week days.
Initial download of the metrics may take a while.