Open Access
Fig. 1.
Download original image
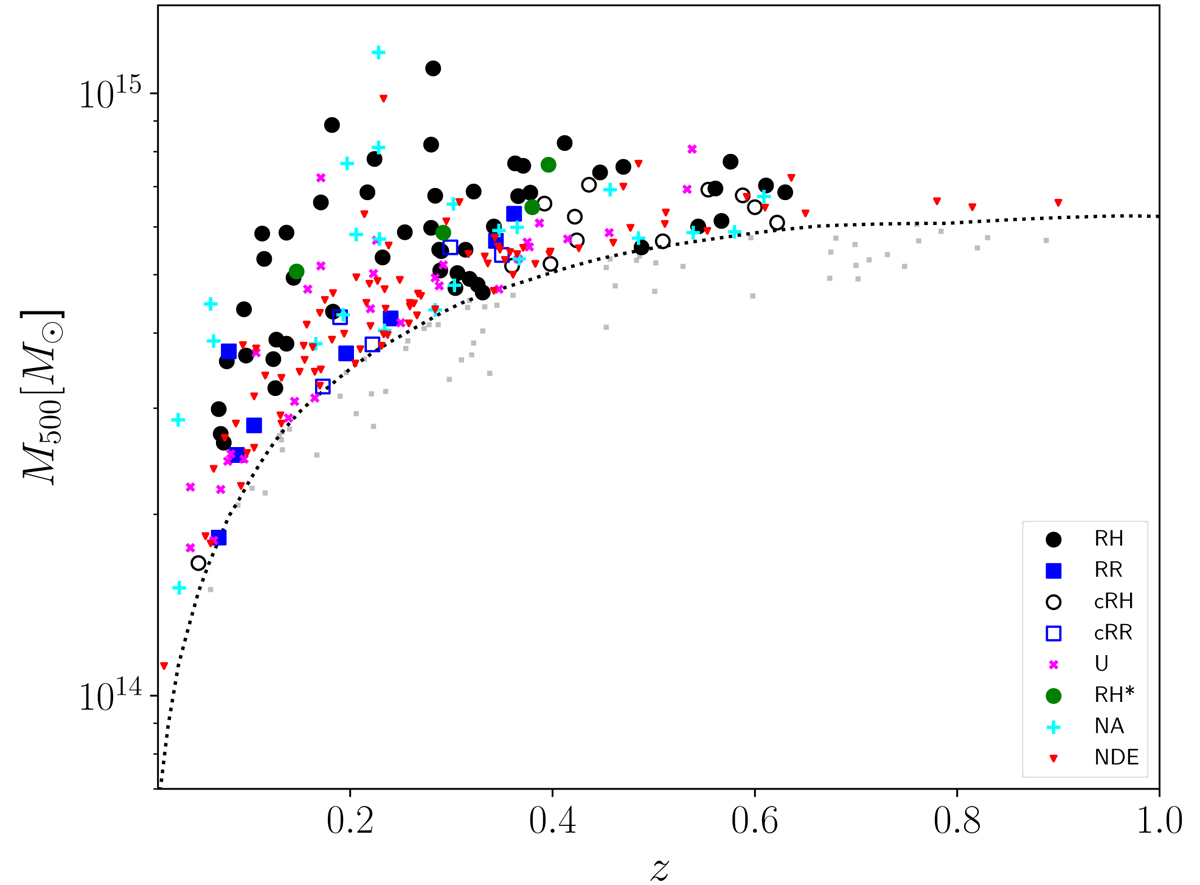
Mass–redshift distribution of the clusters of the sample. Clusters above the 50% Planck completeness line (dotted line) are marked depending on their classification. Grey points represent clusters below the 50% completeness line and are not considered in this paper.
Current usage metrics show cumulative count of Article Views (full-text article views including HTML views, PDF and ePub downloads, according to the available data) and Abstracts Views on Vision4Press platform.
Data correspond to usage on the plateform after 2015. The current usage metrics is available 48-96 hours after online publication and is updated daily on week days.
Initial download of the metrics may take a while.