Open Access
Fig. 7.
Download original image
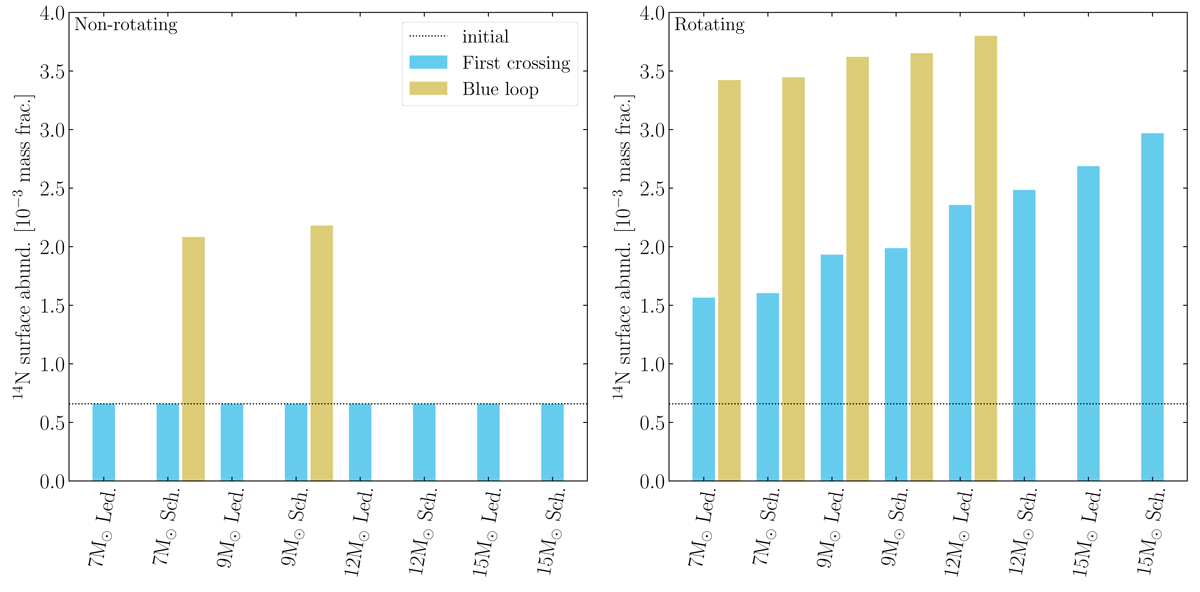
Surface abundances of 14N before (cyan bar) and during (yellow bar) the blue loop for stars between 7 and 15 M⊙. The dotted line indicates the initial surface abundance. Left panel: non-rotating model. Right panel: rotating model.
Current usage metrics show cumulative count of Article Views (full-text article views including HTML views, PDF and ePub downloads, according to the available data) and Abstracts Views on Vision4Press platform.
Data correspond to usage on the plateform after 2015. The current usage metrics is available 48-96 hours after online publication and is updated daily on week days.
Initial download of the metrics may take a while.