Fig. 4.
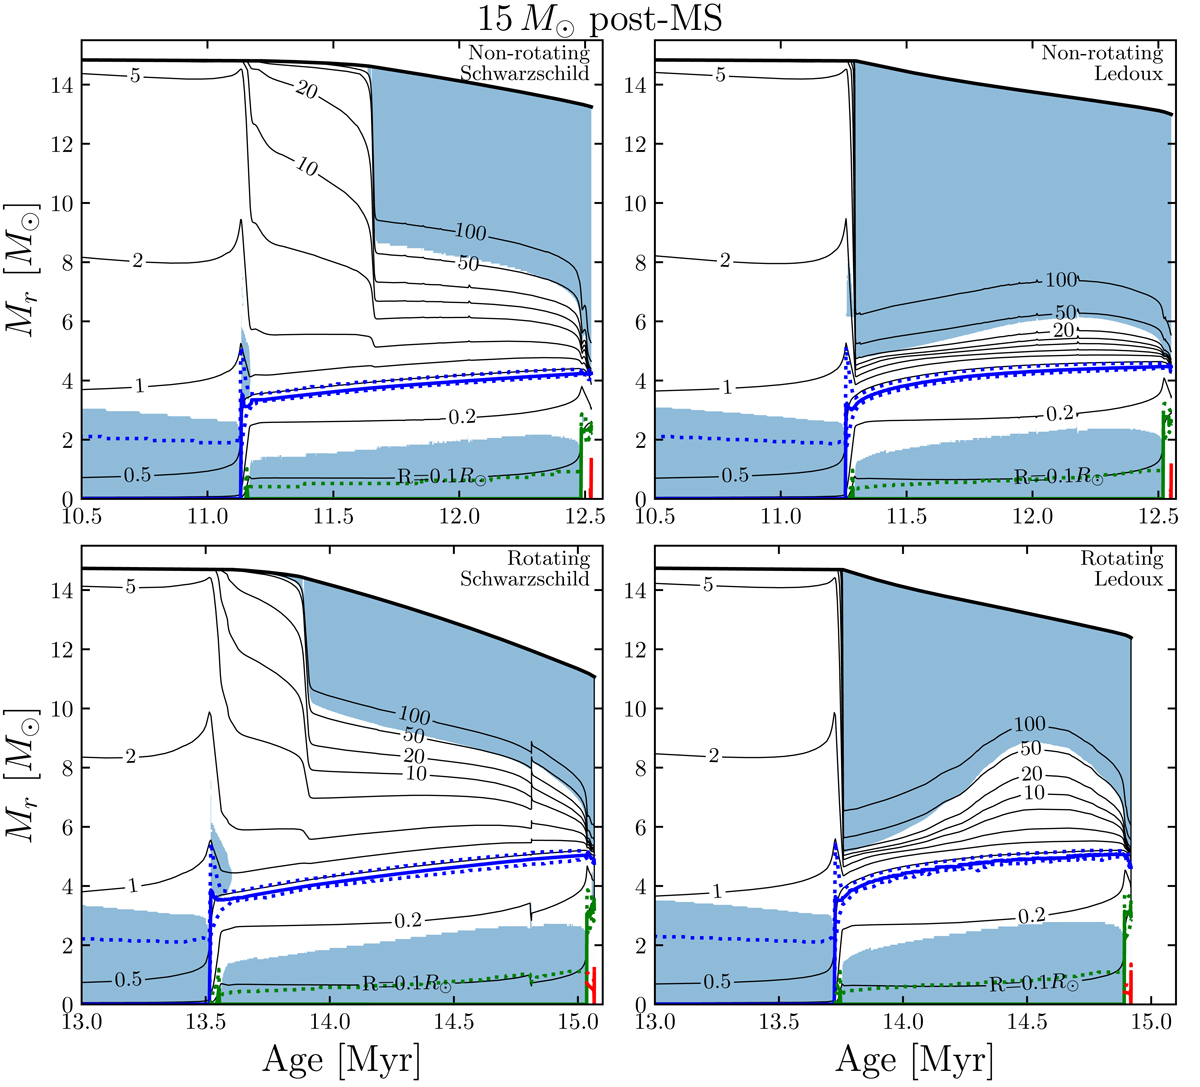
Download original image
Kippenhahn diagrams showing the post-MS phases for the four models computed with an initial mass of 15 M⊙. The vertical axis shows the mass coordinate, and the numbered lines show isoradius levels. Left column: Schwarzschild models. Right column: Ledoux models. Upper row: non-rotating models. Lower row: rotating models. The intermediate convective zone above the H-burning shell is clear in the Schwarzschild models and is associated with the slower expansion of the envelope.
Current usage metrics show cumulative count of Article Views (full-text article views including HTML views, PDF and ePub downloads, according to the available data) and Abstracts Views on Vision4Press platform.
Data correspond to usage on the plateform after 2015. The current usage metrics is available 48-96 hours after online publication and is updated daily on week days.
Initial download of the metrics may take a while.