Open Access
Fig. 10.
Download original image
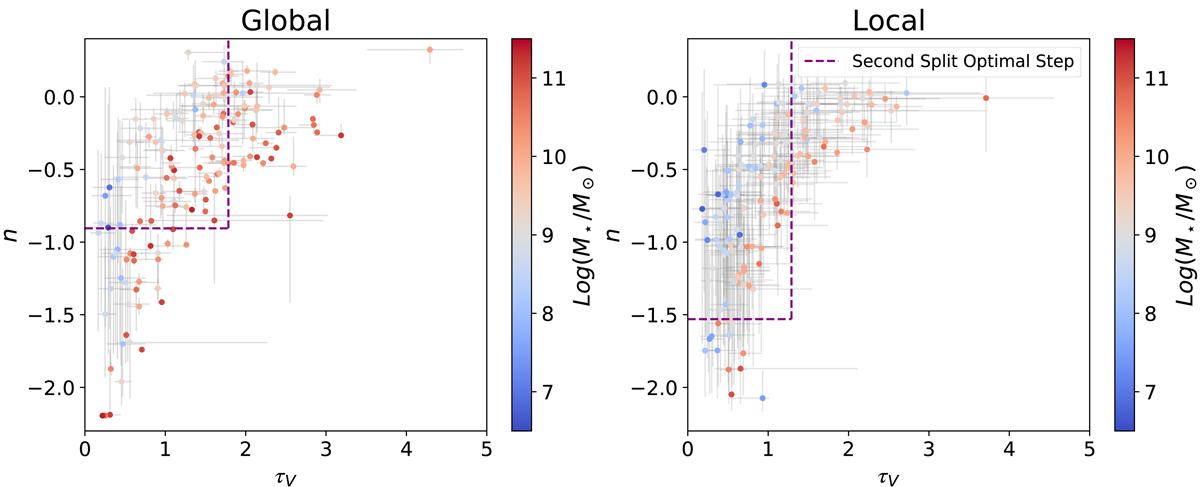
Best-fit values of n as a function of τV for the fitted DES galaxies with DECam global (left panel) and local (right panel) griz photometry. The corresponding value of log(M⋆/M⊙) is plotted on a gradient from blue (lower mass) to red (higher mass). The optimal step for the Second Split is also shown in purple.
Current usage metrics show cumulative count of Article Views (full-text article views including HTML views, PDF and ePub downloads, according to the available data) and Abstracts Views on Vision4Press platform.
Data correspond to usage on the plateform after 2015. The current usage metrics is available 48-96 hours after online publication and is updated daily on week days.
Initial download of the metrics may take a while.