Fig. 9

Download original image
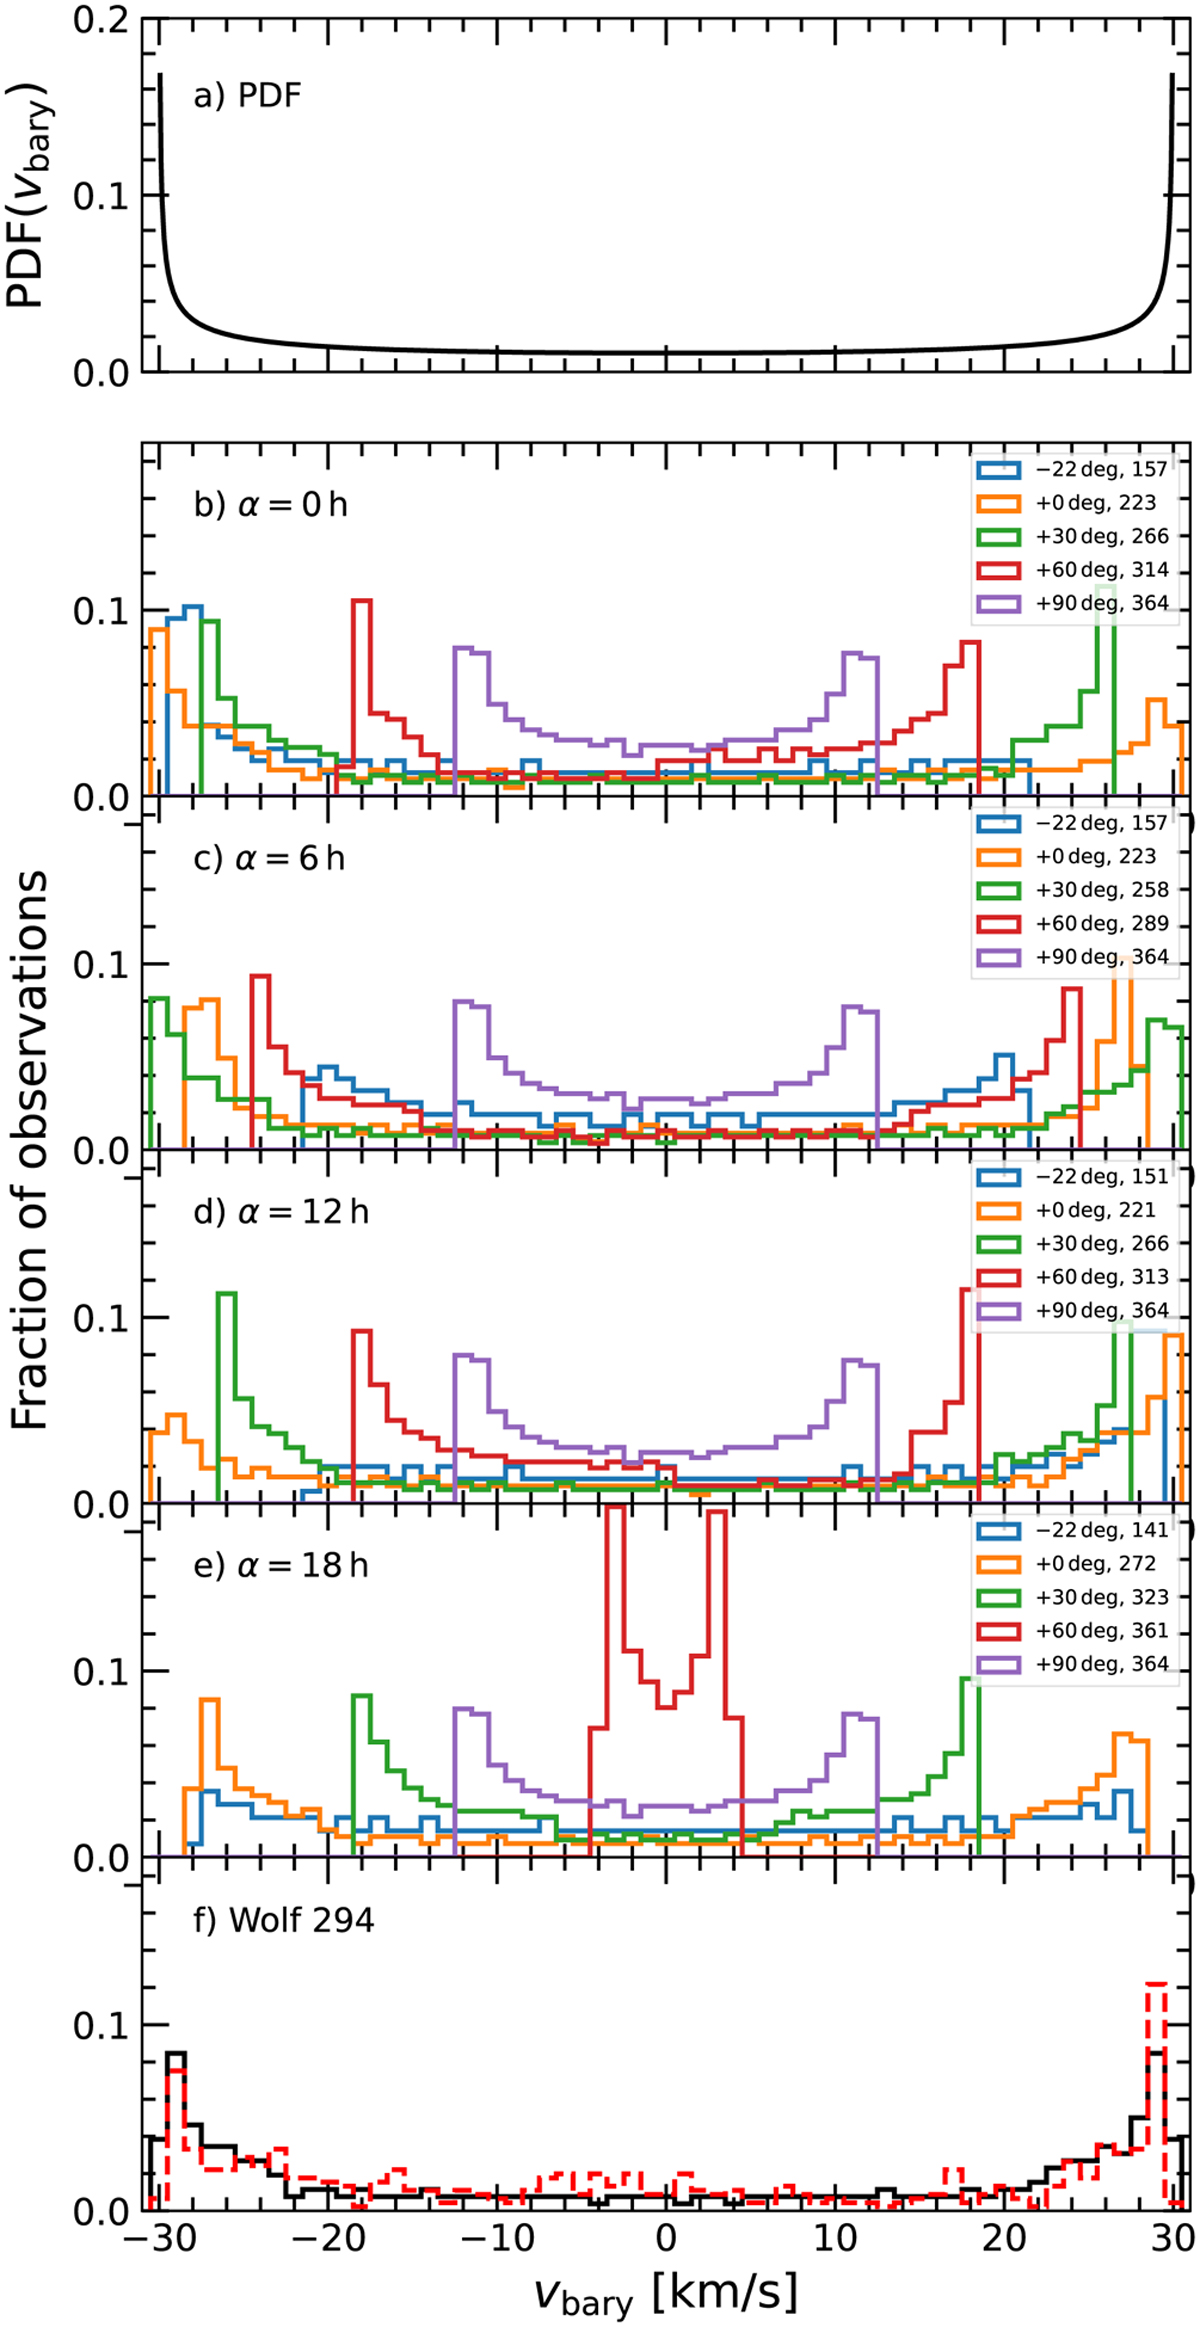
Barycentric velocity distributions corresponding to various coordinate sets. Panel a: probability density function PDF(υbray) as computed with Eq. (13). Panels b-e: simulated barycentric velocity distributions for targets with a = 0 h, 6 h, 12 h, and 18 h, and δ = −22 deg, 0 deg, +30 deg, +60 deg, +90 deg, assuming one daily measurement over a time span of 1 yr and considering the target visibility. The second entry in the legend is the number of total observing nights. Panel ƒ: simulated barycentric velocity distribution of Wolf 294 (black line). The barycentric velocity distribution for the datasets of Wolf 294 (dashed red line) is overplotted.
Current usage metrics show cumulative count of Article Views (full-text article views including HTML views, PDF and ePub downloads, according to the available data) and Abstracts Views on Vision4Press platform.
Data correspond to usage on the plateform after 2015. The current usage metrics is available 48-96 hours after online publication and is updated daily on week days.
Initial download of the metrics may take a while.


