Fig. 2
Download original image
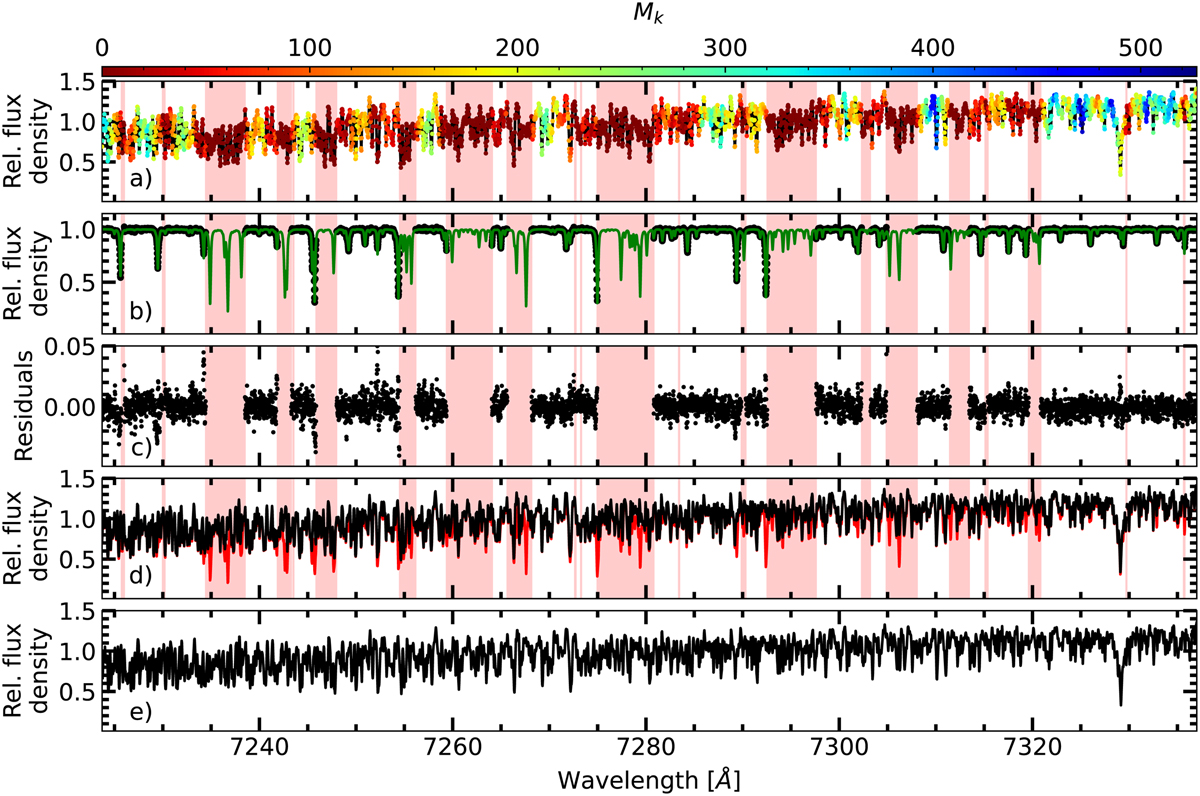
Illustration of the TDTM method. Panel a: segment of the VIS template spectrum of Wolf 294. The number Mk of exposure pixels that contribute to each template knot is color-coded. The red shaded wavelength ranges mark knots with Mk = 0. Panel b: one residual telluric spectrum Fn,i/S (λn,i) (black dots) after the division of the science spectrum by the template, and the best-fit telluric model (T(λn,i), green line) derived with molecfit. The red shaded wavelength ranges are excluded from the transmission model fit. Panel c: absolute residuals Fn,i/S(λn,i) – T(λn,i) of the fit. Panel d: CARMENES spectrum before (Fn,i, red line) and after (Fn,i/T(λn,i)) correction with the transmission model derived with molecfit (black line). Panel e: telluric free high S/N template spectrum of Wolf 294 (black line) built using 444 telluric absorption- corrected CARMENES observations. The order has a S/N of 2310.
Current usage metrics show cumulative count of Article Views (full-text article views including HTML views, PDF and ePub downloads, according to the available data) and Abstracts Views on Vision4Press platform.
Data correspond to usage on the plateform after 2015. The current usage metrics is available 48-96 hours after online publication and is updated daily on week days.
Initial download of the metrics may take a while.