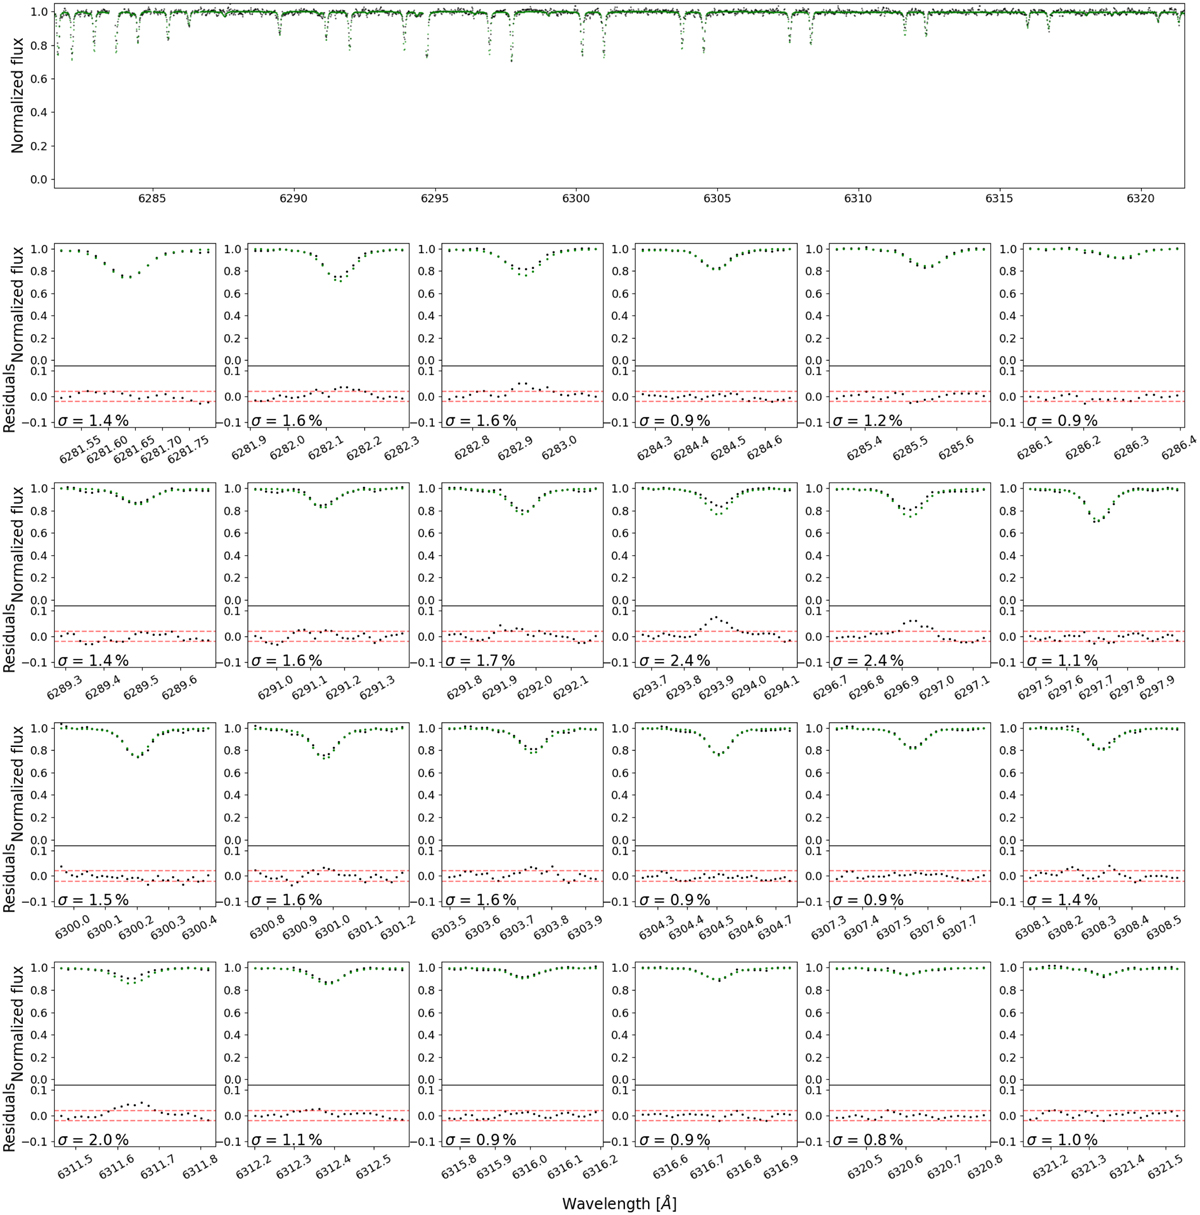
Fig. B.1
Download original image
Example of telluric line fits for the O2 band in a single Wolf 294 spectrum. The top panel displays the residual telluric spectrum (black dots) after dividing the science spectrum by the stellar template, and the best-fit telluric model (green dots) derived with molecfit. The subplots illustrate the individual telluric lines (top) and the residuals (bottom, black dots), with dashed red lines marking a 2% deviation between data and model. The standard deviation σ of the residuals is also shown in each subplot.
Current usage metrics show cumulative count of Article Views (full-text article views including HTML views, PDF and ePub downloads, according to the available data) and Abstracts Views on Vision4Press platform.
Data correspond to usage on the plateform after 2015. The current usage metrics is available 48-96 hours after online publication and is updated daily on week days.
Initial download of the metrics may take a while.